Stocks reversed dramatically in the final hour of trading yesterday, ending the session mixed. All the major indices were down 1.2% or more intraday before the market staged its impressive comeback. The S&P MidCap 400 showed relative strength, as it fought its way back from early losses to post a 0.3% gain. The small-cap Russell 2000 ended the session flat, while both the Dow Jones Industrial Average and S&P 500 settled with modest 0.2% declines. The Nasdaq Composite also made an impressive recovery, but still finished the lower by 0.9%. At its lowest point of the session, the tech-rich index was down by 2.0%. Trade was also brisk, indicating the presence of institutional trading activity.
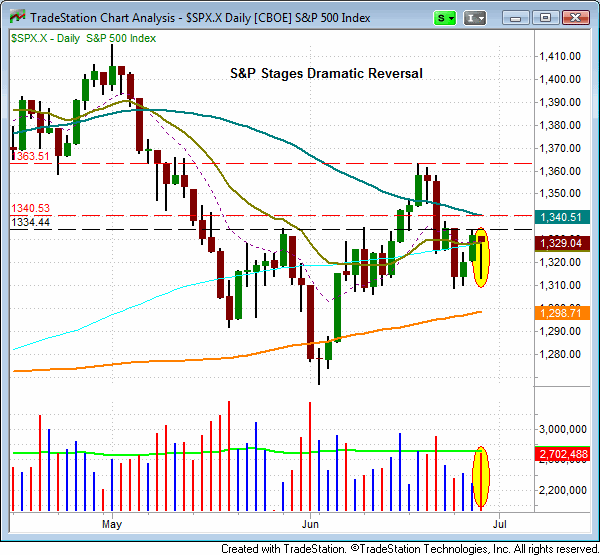
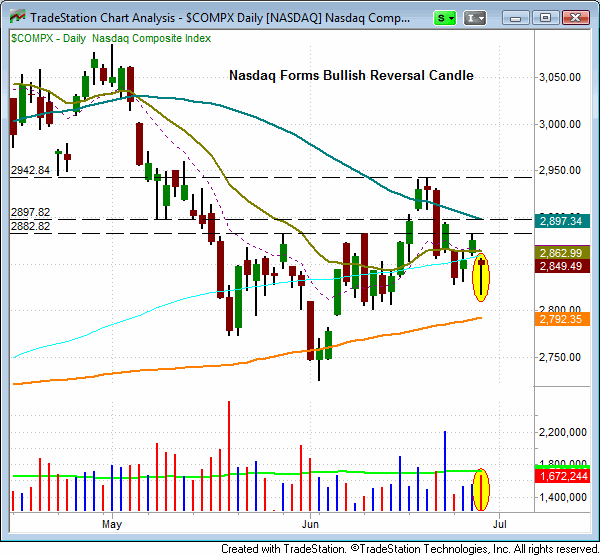
A quick technical analysis review of the S&P 500 and Nasdaq Composite should provide a compelling visual as to the strength of yesterday’s reversal.
In the first half of the trading session, the S&P 500 quickly lost support of its 20-day exponential moving average (EMA) yesterday, and appeared ready to test key near-term support of its four-day low. However, after setting the intraday low near the 2:30 pm reversal period, the S&P rallied in the final hour of trading to close near the day’s high. This formed a bullish “reversal bar” candlestick on the daily chart, but with little relevance given the choppy, indecisive trading range of late. From here, the next near-term resistance levels for the index will be found at the two-day high of 1,334, followed by resistance of the 50-day moving average (MA) at the 1,340 area and June “swing high” around 1,364.

The Nasdaq Composite also recovered strongly yesterday. Initially, the Nasdaq appeared to be in big trouble when it fell through key support of its four-day low. However, the tech-rich index also turned tail to close near session highs. The Nasdaq should now find resistance at its 20-day EMA (the 2,862 area), the two-day high (2,882), and 50-day EMA (2,897) and the June 20th “swing high” of 2,942.

As the charts above illustrate, both the Nasdaq and the S&P 500 still face formidable overhead resistance and price supply to contend with. Nevertheless, yesterday’s price action suggests to us that market bears may be on the verge of ceding control…at least for a while. Overall, recent weeks can be summarized as a tug-of-war between the bull bears, with neither team showing convincing dominance. Obviously, this has made it challenging to allow solid technical swing trade setups to follow through in either direction for more than a day or two. Nevertheless, we have been riding the volatility pretty well, eeking out small profits on both sides of the market, while keeping a primary focus on capital preservation. We simply must take what the market gives us…and lately, that hasn’t been much (at least for technical swing traders). Although the timing model is on a sell signal we are simply one “follow through-day” away from generating a buy signal. With this in mind, we are willing to establish a few long positions with reduced share size, risking about $200 per trade (based on our $50,000 model trading account).
The above commentary is an excerpt from our nightly Wagner Daily swing trader newsletter that also provides subscribers with detailed entry and exit prices of our top ETF and stock picks, based on technical analysis. Sign up for a 30-day risk-free trial subscription to give it a try.
