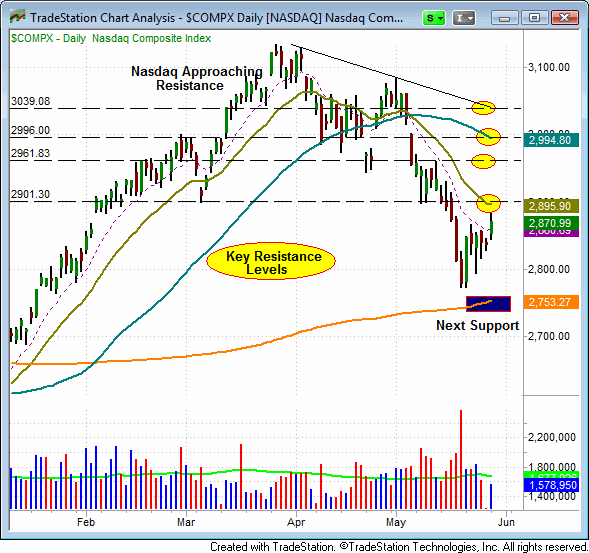
Over the past five sessions, the stock market has begun showing signs of a potential bullish reversal. However, there is still a lot of overhead supply stocks must overcome, so we are cautious about changing our bearish sentiment of the market. A quick technical review of support and resistance levels on the daily charts of the Nasdaq and S&P 500 should help clarify why we are not overly anxious to revert back to the long the market without further confirmation. Let’s start with a snapshot of the Nasdaq Composite:

On the chart above, notice the Nasdaq is approaching near-term resistance of its 20-day moving average at the 2,900 area. If it is able to reclaim this key mark (former support that has now become resistance), there is still an ample supply of sellers at the 2,960, 3,000 and 3,040 levels. Further, it is unusual for an index to lose support of its 20-day and 50-day moving averages and fall to within striking distance of its 200-day moving average without at least testing or “undercutting” its 200-day moving average.
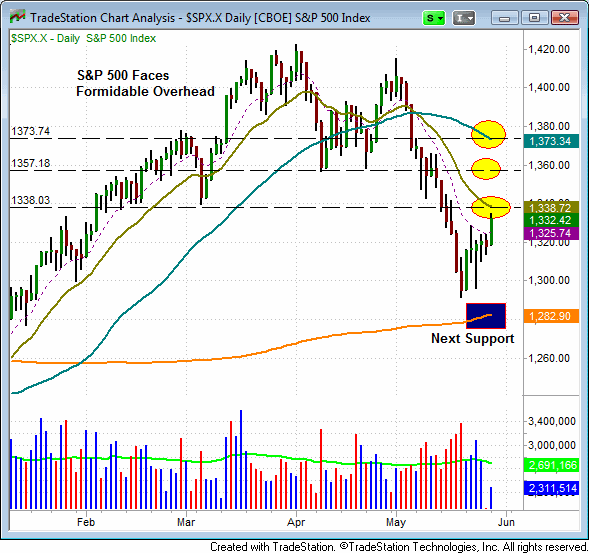
The benchmark S&P 500 Index also faces formidable resistance. The S&P is now within six points of its 20-day EMA (1,340 area). If it can reclaim support of its 20-day EMA, the S&P still must work its way through key overhead resistance near 1,360 and 1,375. As with the Nasdaq, the S&P 500 has major support at its 200-day. Again, it is unusual for an index to come within striking distance of the 200-day MA without testing it first.

Yesterday’s stock market performance was impressive, as it resulted in an “accumulation day” for both the NYSE and Nasdaq. However, price action was a bit weaker than we like to see in order to declare a “buy” signal for the broad market. Despite yesterday’s bullish price action, there simply isn’t enough evidence to support going long right now, especially with the major averages below the 50-day MA. Nevertheless, yesterday’s “accumulation day” comes on the heels of last Wednesday’s bullish reversal day. Although our market timing model remains on a “sell” signal, we have to be respectful that the market could put in a buy signal quickly. Right now, astute traders must be patient and wait for low risk short setups to develop by the end of the week OR the less likely scenario of a new buy signal to trigger.
The commentary above is an excerpt from The Wagner Daily stock newsletter. Subscribers to the full version also receive our exact entry and exit prices for swing trade setups of the best stocks and ETFs, access to our market timing model, and more. Test drive our stock newsletter with the top stock picks and ETFs with your risk-free trial subscription.
