Although we now have a new “buy” signal in place with our market timing model, each of the main stock market indexes must now contend with key resistance of their 50-day moving averages (50-day MA). This suggests that stocks may either pullback from or consolidate at current levels over the next several sessions. As such, let’s take a look at the current technical support and resistance levels for two popular benchmark indexes, the Nasdaq Composite ($COMPQ) and S&P 500 Index ($SPX).
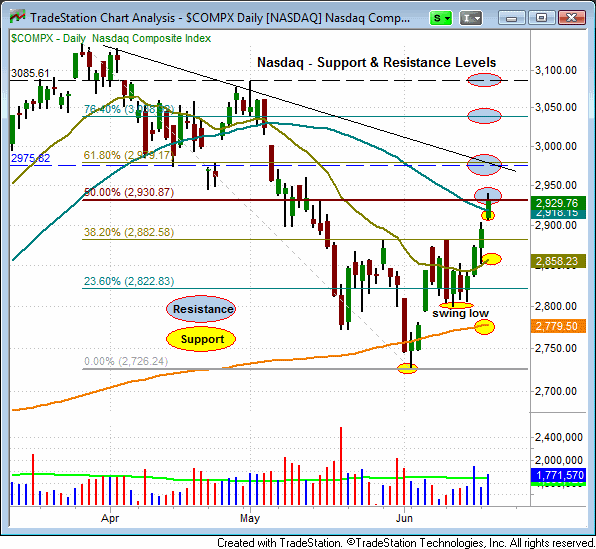
On a burst of volume, the Nasdaq closed above its 50-day MA yesterday, so this prior level of resistance should now offer new support. One of the most basic tenets of technical analysis is that a prior level of resistance becomes the new level of support after the resistance is broken (and vice versa). Nevertheless, it is not unusual for a stock, index or ETF to pull back from its first attempt to crack through a major moving average following a significant move lower.
If the Nasdaq holds above its 50-day MA, its next significant resistance level is near the 2,980 area. If the index eventually retraces from its current level, it will probably first retest and find resistance at yesterday’s high before moving lower. Above this mark, the Nasdaq has significant overhead resistance near 2,980 and 3,085. Yesterday’s (June 19) intraday low, the 20-day exponential moving average (20-day EMA), and the 200-day moving average (200-day MA) should all act as important support levels for the Nasdaq. Using supplemental Fibonacci retracement levels, the daily chart of the Nasdaq Composite below clearly summarizes all this:

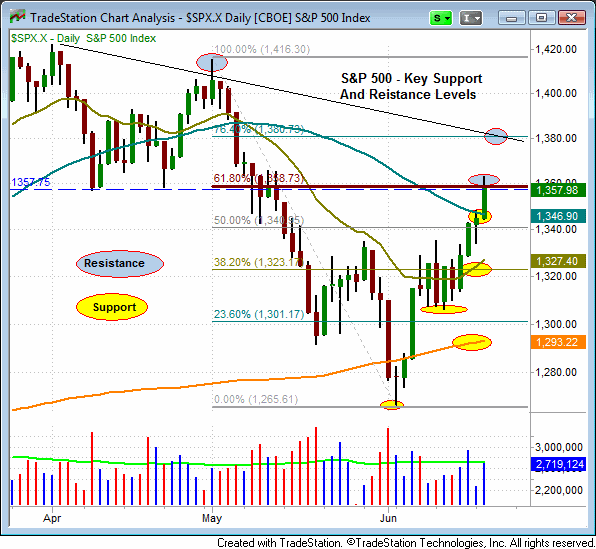
The S&P 500 Index also surged above its 50-day MA yesterday, and on higher volume. Yesterday’s high (1,363), as well as the 1,380 and 1,420 levels all present near to intermediate-term resistance levels for the S&P. As with the Nasdaq, the 50-day, 20-day and 200-day moving averages are significant support levels on the S&P 500:

With the stock market in “buy” mode, we will be focusing most of our attention on identifying potential ETF and stock setups to buy during market pull backs. It would now take several significant “distribution days” (higher volume selling) to nullify recent bullish price action on the long side of the market. However, keep in mind that the first move higher following a substantial market correction does not generally yield stellar results because new leadership in the stock market is just becoming established. Most important is that we continue to see institutional accumulation during pullbacks, and as the stock market works its way higher.
