 We love sharing objective walk-throughs of past stock trades because doing so reinforces the rules of our simple trading system.
Our annotated trade reviews also give you key tips to help improve your trading results.
Today, we’re talking about a recent winning trade in mobile payment provider Square, Inc. ($SQ).
First, you will see what the chart looked like at the time of buy entry.
Then, you will see the crucial sell signal that prompted us to lock in a 34% gain several months later.
We even show you our re-entry back into $SQ — not a big winner, but a valid trade setup nonetheless.
Continue reading to find out about the “slap me in the face buy signal” and other tips to improve the profitability of your next winning trade.
Slap Me Square In The Face
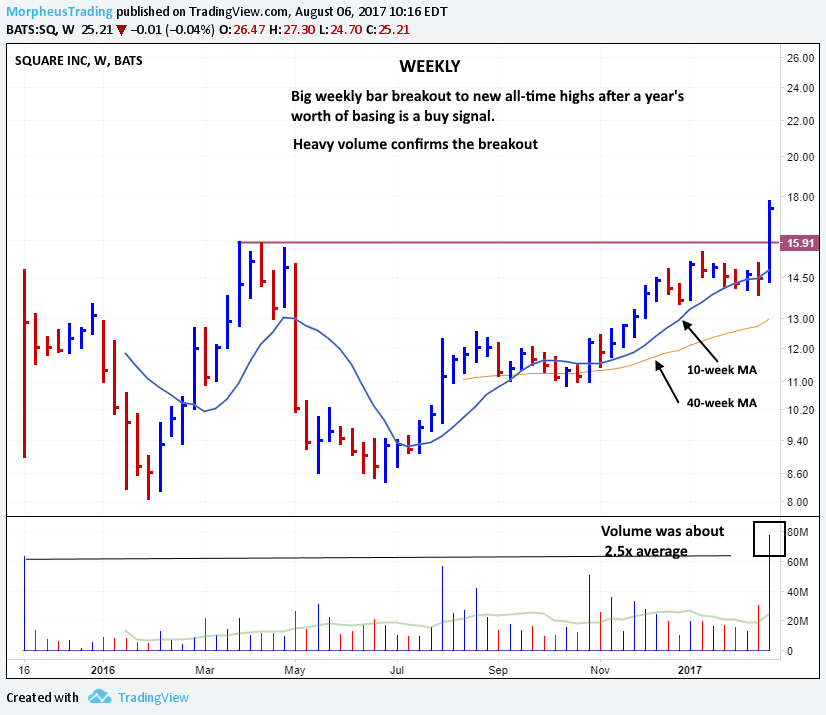
Mobile payment provider Square ($SQ) generated a “slap me in the face buy signal” on February 23, with a 14% breakaway gap-up to new all-time highs.
The bullish price action was confirmed by massive volume that spiked to 300% its average level by the end of week.
Indicative of institutional buying, the volume surge was the largest since the Square IPO in late 2015:

Prior to the breakout, the stock formed a base of consolidation for just over a year.
Longer consolidations tend to produce more explosive breakouts, so the lengthy base confirmed the breakaway gap higher.
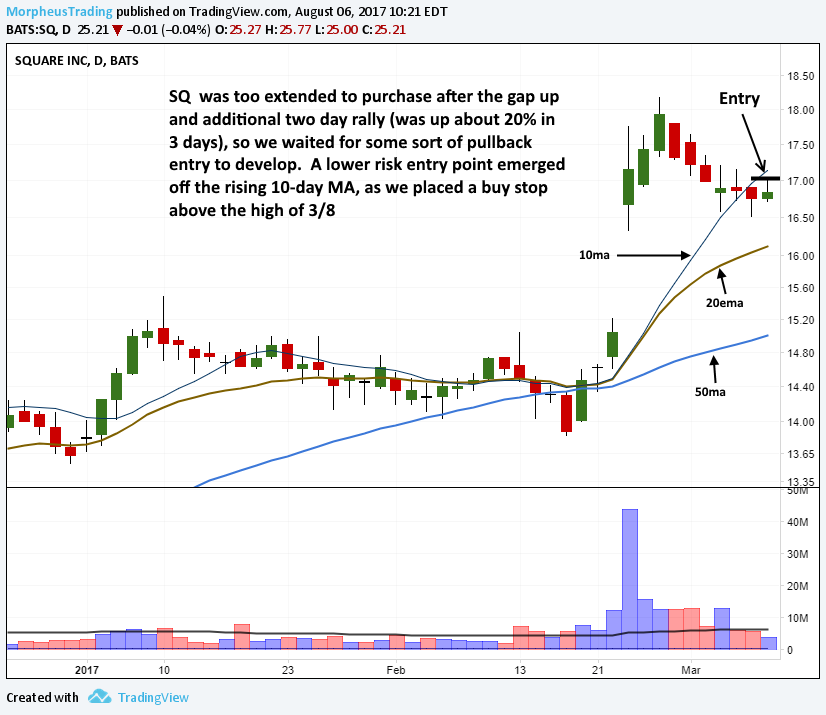
But although we had a proper buy signal on the weekly chart interval, the daily chart showed a gain of 20% in just a few days.
As such, we patiently sat on the sidelines and wait for a low-risk entry point to develop.
Wiggle Room
The low-risk buy entry we were waiting for emerged after a four-day pullback to the rising 10-day moving average, followed by a bullish reversal candle on March 7.
The next day, $SQ chopped around a bit, but held well above the previous day’s low — thereby creating a valid buy signal above the two-day high.
That same evening, we listed $SQ as an “official” buy setup in The Wagner Daily report.
Our buy trigger was above the March 8 high, while we placed the protective stop well below the 20-day exponential moving average (20-day EMA).
The stop placement gave the setup plenty of “wiggle room,” which is important when stocks are settling in from a pullback:

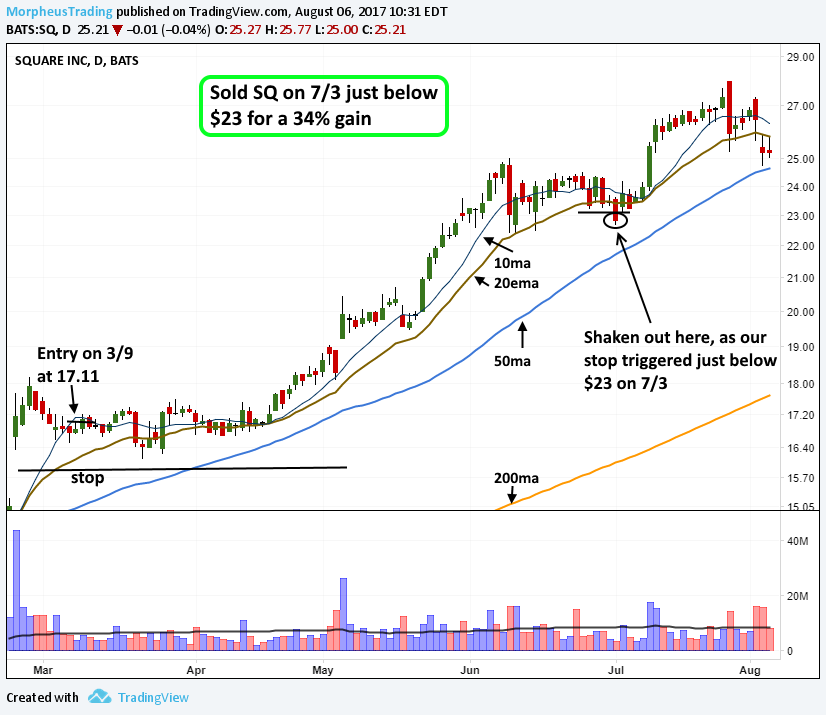
The wider than normal stop paid off (wiggle room) because $SQ initially struggled and closed below the 20-day EMA two days in row (March 21-22) before reversing higher.
However, the stock was quite easy to manage once it finally got moving with bullish momentum again.
Patience Pays Off (Again)
$SQ barely even dipped below the rising 10-day moving average during the nearly two-month rally that followed a few weeks later.
On June 9, $SQ closed with a bearish candle on a pick up in volume.
But with the 20-day EMA just below, we decided to hold on to our position and see how the price reacts when it comes into the 20-day EMA.
It turned out to be a good move because the price held the 20-day EMA and continued to push higher.
In late June, we raised the stop in $SQ looking to protect profits after a +40% move.
Our protective stop finally triggered on July 3, knocking us out of the position with a +34% gain:

Back To The Well
When a strongly trending stock hits our stop, it doesn’t mean we file it away and never look at the stock again.
On the contrary, you should always monitor strong stocks for a valid re-entry point because the trends last longer than you might expect.
So, after stopping us out, $SQ reversed right back above its 20-day EMA and held, forming a very tight consolidation above the rising 20-day EMA.
Although we were just stopped out, we felt this pattern was too good to pass.
Accordingly, we placed a buy stop to re-enter above the high of July 5, which triggered for buy entry in our stock pick newsletter on July 11.
The entry worked well at first, as $SQ responded with a 10% move in two days.
However, from there the price action stalled around $27, which was then followed by an ugly reversal candle on July 27.
Just as the massive gap higher in February was a “slap me in the face buy signal,” the bearish engulfing candlestick of July 27 was an equally obvious bearish signal.
Now playing defense, we raised our stop to just below that day’s low.
A few days later (August 3), we stopped out with a small 2% gain when the price dropped below the July 27 low:

Although the re-entry did not work as planned, we wanted to show you that it’s absolutely fine to re-enter a position IF the setup is still valid.
Of course, it sucks to get stopped out of a position and see it reverse higher within a few hours, or the very next day.
But when you stay focused in the present, and not look for reasons/excuses why your stop was hit, new opportunities are always just around the corner.
We love to hear from our followers and fellow traders, so drop us a line below with your comments or questions.
