Stocks recovered from early session losses to end mixed on Monday. The Dow Jones Industrial Average closed fractionally lower, while both the S&P MidCap 400 and small-cap Russell 2000 ended the session flat. Both the Nasdaq and S&P 500 eked out 0.1% gains. The homebuilder, banking and transportation sectors showed strength on Monday, while the gold miner and oil services sectors struggled.
Market internals ended the session positive. Volume jumped by 8.1% on the Nasdaq and 19.9% on the NYSE. Advancing volume outpaced declining volume by a ratio of 1.2 to 1 on the NYSE and 1.4 to 1 on the Nasdaq. Despite the bullish market internals, price action was not strong enough to justify labeling yesterday as an accumulation day for the broad market.
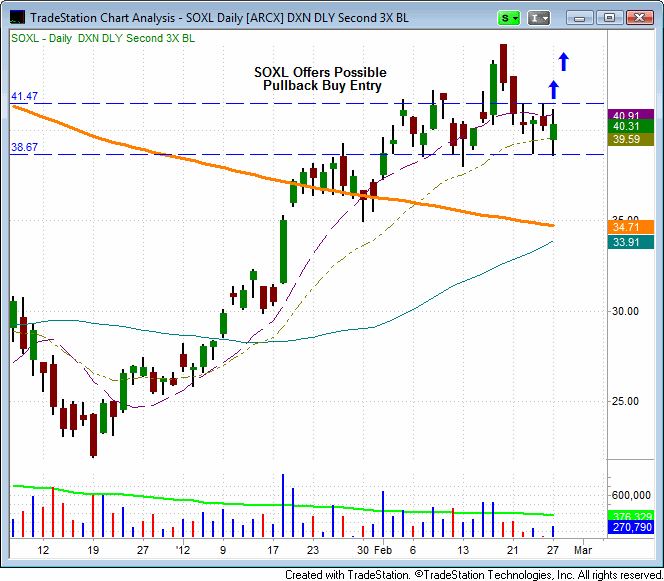
Yesterday, on a spike in volume, the Direxion Daily Semiconductor 3x Bull ETF (SOXL) formed a reversal candle for the second time in four days, as it tested support below its 20-day EMA. Further, this price action occurred on an uptick in volume and SOXL closed in the upper 40% of the day’s range. A rally above the four day high of $41.47 could provide a buy entry trigger for SOXL. We will be monitoring SOXL carefully for a potential long entry.

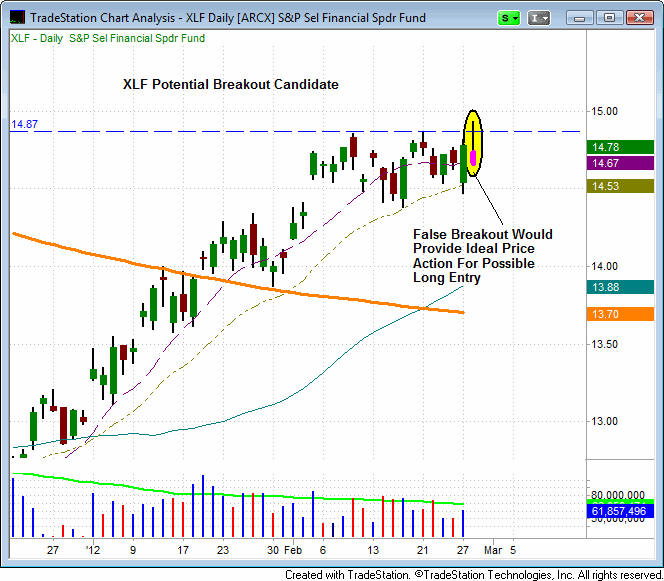
As with many ETFs yesterday, the SPDR Select Sector Financial ETF (XLF) formed a bullish reversal candle and closed near session highs. XLF is now perfectly positioned to break to higher ground. A move above $14.87 appears to be the perfect long entry trigger for this ETF. Is it? The answer is yes, and no. XLF could very easily surge to a new closing high if it clears $14.87. However, we are always cautious of entries that are “too good to be true”. When an entry is obvious, all eyes are trained on the setup. We have found that when a setup is “too obvious”, false breakouts often occur. Consequently, if we enter an obvious breakout trade such as XLF, we do so with the full understanding that a false breakout is a distinct possibility. This prepares us psychologically to accept the pullback as part of the trade. We also use false breakout candles as the pivot for a more reliable trade entry.

IYM came within one cent of hitting its stop yesterday but eventually recovered to close near session highs. PPH also reversed strongly from early session losses to set a fresh 52-week closing high. IAU closed slightly lower, as it continues to consolidate following last week’s breakout. Yesterday’s price action resulted in the formation of bullish reversal candles on all of the major indices. We will be watching the small-cap Russell 2000 carefully on Tuesday, as a breakout by this index could spark a broad market rally.
The commentary above is an excerpt from our nightly Wagner Daily newsletter. Subscribing members receive detailed entry and exit prices for our swing trade setups, additional annotated ETF and stock charts, technical market commentary, and access to our Live Trading Room. Click here to become a member for as low as $58 per month. Your full satisfaction is guaranteed.
