In this January 30 article on our swing trading blog, we touched on a key psychological element of how to make consistent trading profits. Specifically, the article addressed the importance of trend trading in the same direction as the overall market trend, and continuing trading on that side of the trend as long as the trend continues.
Then, in this technical trading commentary published one day later, we stressed why the most profitable swing traders are those who learn to merely react to the market’s price action that is presented to them at any give time, rather than those who attempt to predict the direction of the next move. The substantial broad market rally that came last Friday, which closed out the week on a high note, perfectly confirmed the trader psychology lessons of our previous two posts.
When stocks sold off on higher volume (“distribution”) last Thursday, January 31, the weak price action was sure to attract some short sellers who keep trying to catch a top, despite the fact the uptrend remains intact. Traders who went ahead and sold short that day quickly got caught with their hands in the cookie jar the following day, as the main stock market indexes gapped about 1% higher on the open and held up throughout the entire day.
If you are new to our short to intermediate-term momentum trading system, please be assured we have no problems selling short when our proprietary market timing system indicates the dominant trend has reversed. There were several months just last year when we profited on the short side. However, we simply do not sell short against the prevailing trend when there is a clear and objective “buy” signal in place.
Top 2 Reasons We Don’t Fight The Trend
- We’ll be really honest with you here. Trying to call a top by entering new short positions when the market is still in a firm technical uptrend is something we have tried to do in the past. Upon doing so, we learned that it hardly ever works. Even in the times when we eventually got it right, it was always after several initial failed attempts, which usually led to a net wash (breakeven result) at best.
- Perhaps more important than the actual losses sustained from those failed countertrend short selling attempts was the psychological damage done, as it was (and always is) emotionally draining to fight a clearly established trend. It’s a bit like trying to swim directly back to shore while stuck in a rip current, rather than swim parallel to the beach until the rip dissipates. Overall, you must realize there is nothing more important to your long-term trading success than protecting capital and preserving confidence. Weakness or lack of discipline in either of these two areas will eventually prevent you from living to trade another day.
All these powerful tidbits of knowledge, and many other psychological trading lessons we’ve learned over the past 11 years, are regularly shared with subscribers of The Wagner Daily end-of-day trading newsletter, and we we proudly display the cumulative trading performance results of our long-term efforts to prove it (Q4 of 2012 will be updated this week).
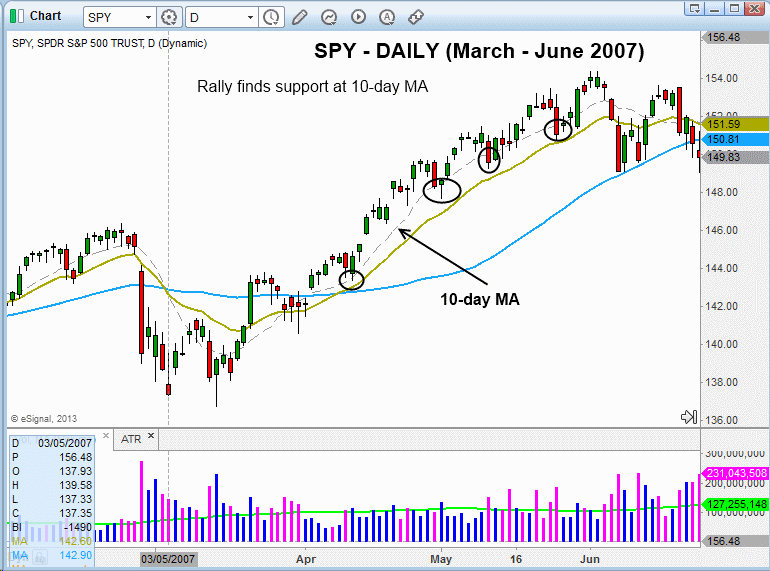
Moving on from the area of trading psychology lessons, let’s look at the current technical situation of the benchmark SPDR S&P 500 Index ETF ($SPY), as we ask ourselves, “Can a market continue to rally while in overbought territory?” Since pictures are always more powerful than words, just take a look at the following daily chart of $SPY from the year 2007. Specifically, notice how the ETF held very short-term support of its 10-day moving average for several months before eventually entering into a correction.

Note the tight price range throughout the rally, which kept finding support at the rising 10-day moving average on the way up, after pulling back slightly for just 2 to 3 days. There are hundreds of other charts over the years in which we could show the same thing. Therefore, the answer is clearly “yes”…an overbought market can continue to run even higher without a deep pullback. Nevertheless, we are not implying the current market rally will match the chart above, in terms of the percentage gain or length of time, as every market rally is unique. Still, this chart simply serves as a guide and reminder for what could and frequently happens in “overbought” (we use the term quite loosely) markets.
Although Friday’s action was bullish, and we now have solid unrealized gains in the open ETF and stock swing trade positions in our model portfolio, we continue to trail tight stops in order to reduce risk and lock in gains whenever possible. As regular subscribers should note on the “Open Positions” section of today’s report, many protective stops have now placed below their respective 20-day exponential moving average, which should provide near-term support during any pullback in the market.
The above commentary is a shortened version of the February 4 issue of The Wagner Daily. To continue building on your trader education, receive access to our proprietary market timing system, and be alerted to our exact entry and exit prices for the top nightly stock and ETF trade picks, sign up here for your 30-day risk-free subscription to our momentum swing trading service.
