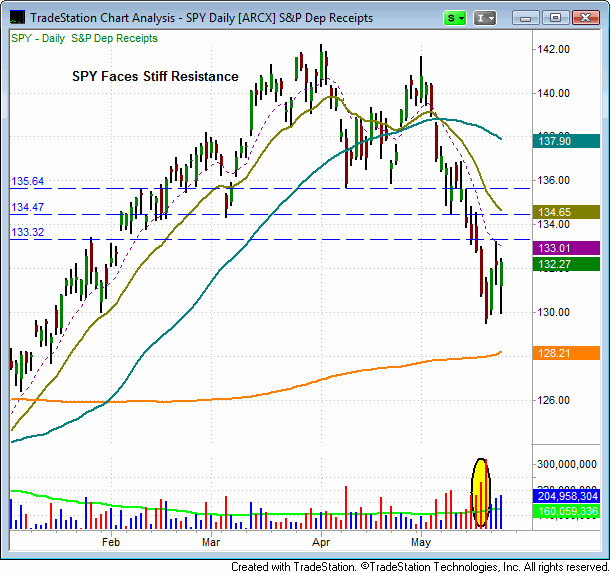
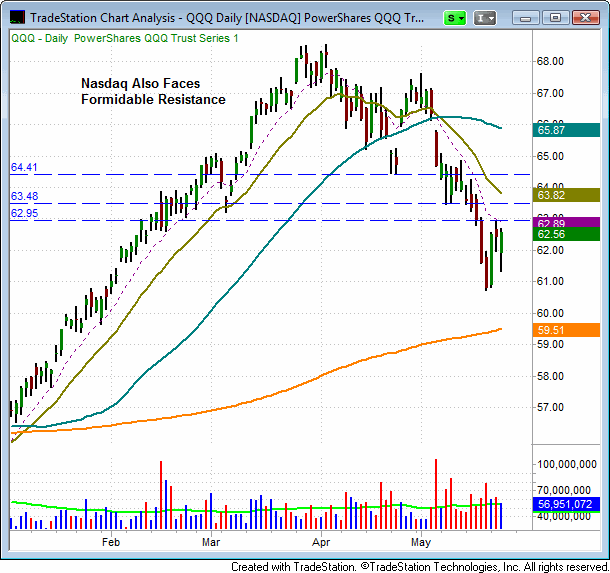
Based on yesterday’s (May 23) bullish intraday price action, in which stocks shook off substantial early losses and reversed to finish flat to higher on increasing volume, it appears as if we will see a move higher in the main stock market indexes over the next several days. However, there is still an abundance of overhead supply (resistance) stocks must contend with, such as their 20 and 50-day moving averages, as well as horizontal price resistance levels.
The self explanatory charts of the SPDR S&P 500 ETF ($SPY) and the ProShares Nasdaq ETF ($QQQ) below, two popular ETF proxies for the broad market, show the next significant resistance levels for both ETFs. The 20-day EMA is the beige line and 50-day MA is the teal line. We will likely be looking to establish new swing trade short positions (or inverse ETFs) as these indices approach these resistance levels (particuarly if the major indices probe above these levels and then form bearish reversal candles).


As yesterday clearly demonstrates, market sentiment can reverse quickly. We went from what was shaping up to be a bearish “distribution day” (higher volume decline), to an “accumulation day” (higher volume advance) by the close. However, we still do not yet have a buy signal in the market and remain bearish on the market. Nevertheless, this could change quickly if the market posts another significant “accumulation day” sometime next week. For the moment, we anticipate short selling opportunities to develop as the market bounces.
The commentary above is an excerpt from The Wagner Daily stock newsletter. Subscribers to the full version also receive our exact entry and exit prices for our best stock and ETF swing trade picks, access to our market timing model, Live Trading Room, and more. You may test The Wagner Daily stock newsletter risk-free for 30 days.
