 Two weeks ago, day-to-day volatility, indecision, and choppy price action in the stock market started picking up substantially.
When indecision and choppy price action starts appearing after an extended rally, it is often a warning sign that a substantial pullback may be just around the corner (especially when combined with higher volume selling in the broad market).
For now, the main stock market indexes are still hanging at or near their recent highs, which is bullish, but will that continue to be the case as we wrap up the month of July?
A lot of that depends on the stock market’s reaction to the slew of upcoming earnings reports.
But in the meantime, let’s take an objective look at a few key charts that could shed some light on that question…
$QQQ – Mixed signals in the NASDAQ 100 ETF
Since healthy bull markets are typically led by the performance of leading growth stocks, let’s analyze the weekly chart patterns of both the Nasdaq 100 ETF ($QQQ) and Russell 2000 Small-cap ETF ($IWM).
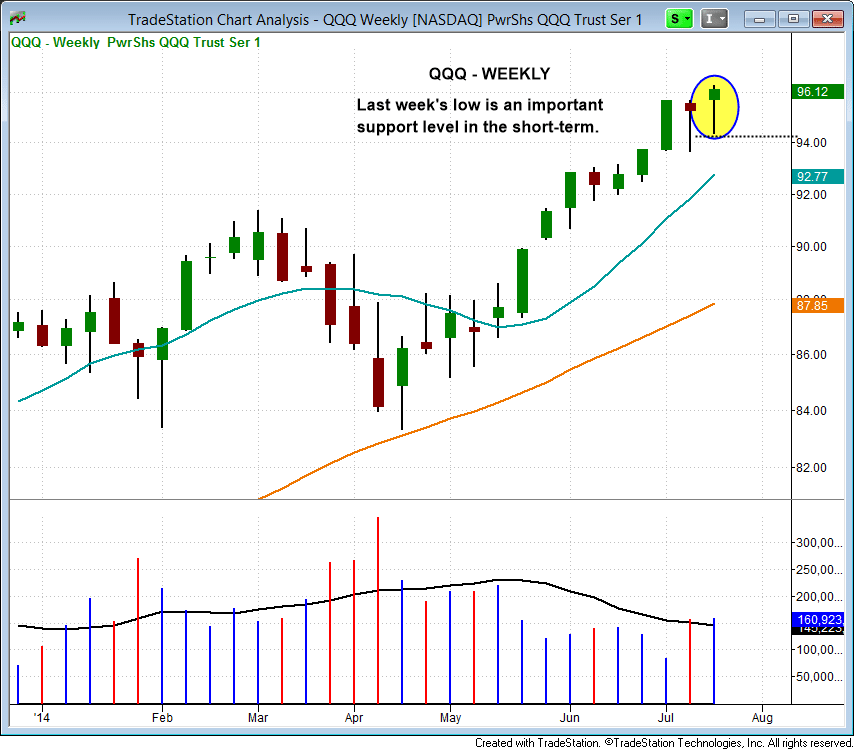
Beginning with $QQQ, the NASDAQ 100 remains in pretty good shape, as it closed back above the 10-day moving average (an important near-term support level for strong uptrends) and within just 20 cents of its prior “swing high.”
On the other hand, $QQQ also formed back-to-back hanging man candlestick patterns (generally bearish) on the weekly chart time frame.
With mixed bullish and bearish signals, last week’s low now becomes a pivotal support level to monitor in the near-term.
If last week’s low is broken this week, we could potentially see a rapid pullback to the 10-week moving average (teal line on the weekly chart below):

By the way, in case you are wondering why I am highlighting the weekly chart time frame, rather than the daily chart, it’s because the weekly chart eliminates much of the “noise” found in the shorter-term daily chart.
Overall, this allows you to focus more on the “big picture” of what is really happening out there.
$IWM – Big volume support in Russell 2000 Small-cap ETF
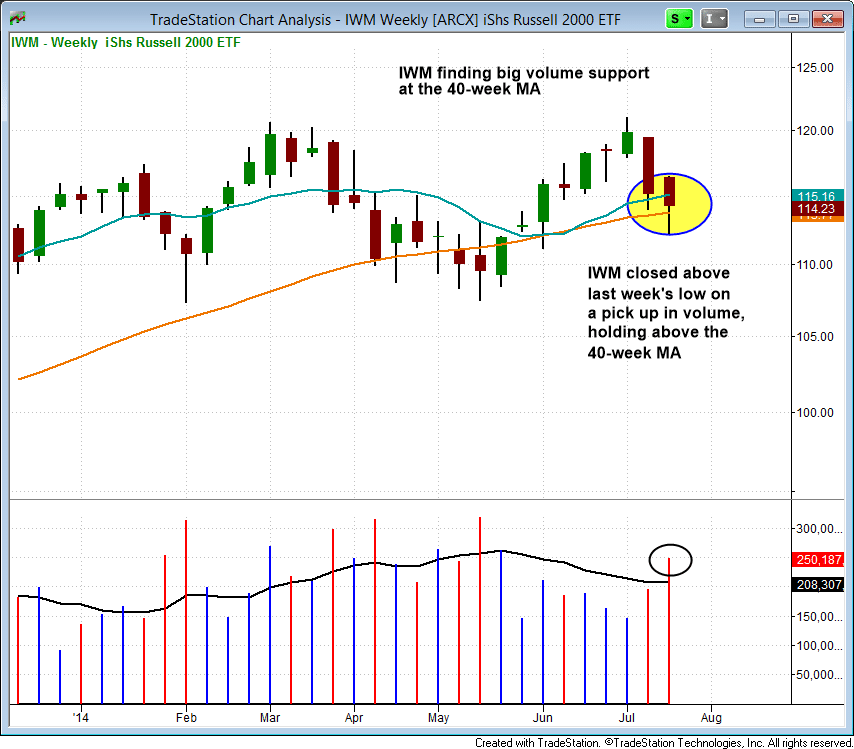
Small-cap stocks may have bottomed out with last week’s heavy volume stalling action in Russell 2000 Small-cap ETF ($IWM).
Although higher volume accompanied last week’s decline in $IWM (hinting at institutional selling), the ETF closed above the prior week’s low and its 40-week moving average, suggesting that buyers were stepping in on weakness:

Despite its pullback to major support, $IWM is not yet actionable on the long side because it may take some time to digest its recent pullback before it can launch to new 52-week highs.
Nevertheless, I am keeping $IWM on my internal watchlist as a potential Wagner Daily buy entry in the coming weeks.
$SPY – Rangebound action in S&P 500 Index
The Nasdaq Composite closed in the middle of its current range, so we could potentially see one or two more days up followed by another pullback to the 4,400 level.
The S&P 500 Index ETF ($SPY), a popular benchmark index for the broad market, has been quite choppy and range-bound.
The NASDAQ Composite (which has been a bit weaker than the NASDAQ 100) has also been range-bound, but the S&P 500 is in a much tighter (albeit choppy) range.
$SPY could potentially touch the highs of its range, then retrace to the lows of its recent range within the next week.
Without a clear breakout to new highs very soon, I expect more choppy price action as stocks head into quarterly earnings season.
“SOH mode” ahead of earnings season
As for new swing trade setups for potential buy entry, most individual stocks that technically look good right now are scheduled to report earnings within the next two weeks.
This gives us good reason to be in “SOH mode” (sitting on hands) with regard to new swing trades, especially after recently locking in some nice gains on $ANET (+15%) and $BDSI (+30%).
As I only stay in stocks through earnings if I already have a large profit buffer from our original buy entry, there really isn’t much that is actionable for me right now.
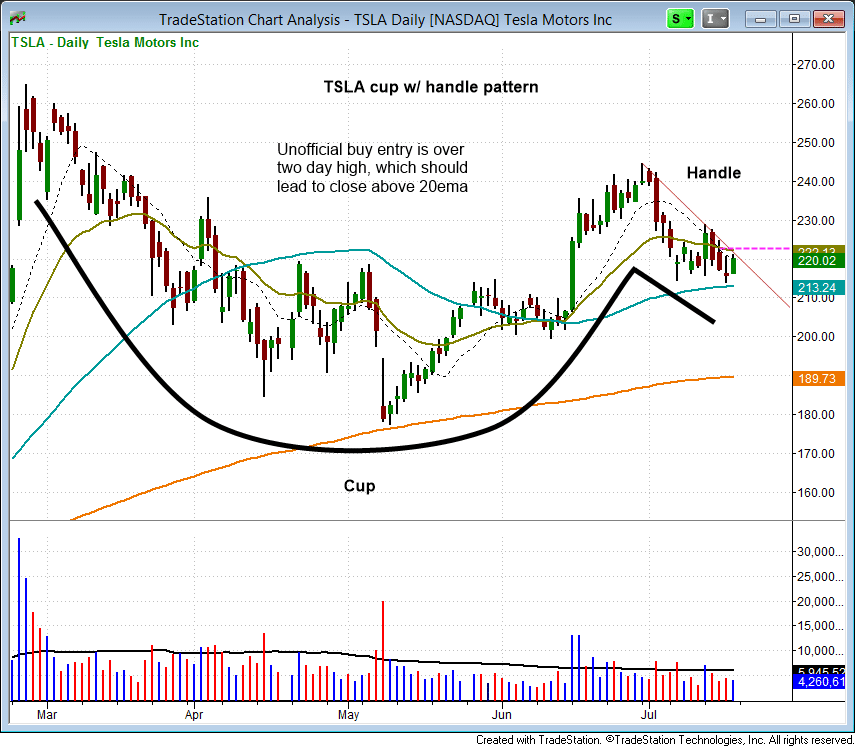
For example, both Tesla Motors ($TSLA) and Facebook ($FB) are “A-rated” stocks forming bullish chart patterns, but earnings are just around the corner ($TSLA reports on July 31 and $FB on July 23).
$TSLA’s bullish cup and handle chart pattern is offering me a low-risk buy point above Friday’s high (around $222), with a stop price around $212.
However, with $TSLA scheduled to report earnings next week, I have not listed this as an “official” swing trade setup in my nightly swing trading report:

Restoration Hardware ($RH) and Palo Alto Networks ($PANW) are two bullish stocks that have already reported earnings, but the chart patterns are not exactly actionable for ideal buy entry yet.
I will continue monitoring both charts for low-risk buy entries to develop within the next two weeks.
In the meantime, we will keep riding the gains in existing Wagner Daily stock trade winners such as $TSEM (+21% unrealized gain) and $ENPH (+29% so far).
If either stock meets my strict criteria for buy entry, I will provide subscribing members of my nightly stock pick newsletter with exact entry, stop, and target prices in the report.

Let me know the currency INR support and resistance level in a current situation
Interesting, thanks for the analysis Deron. QQQ looks interesting.
Marc,
http://brokernotes.co
Marc,
Glad you enjoyed the commentary.