 Many new swing traders struggle with stock selection, with most simply limiting their stock trading to a handful of the most popular stocks in the market.
Stocks that traders typically follow have a huge float (shares available for trading) and move at a snails pace, or not much faster than the S&P 500 itself.
However, to make consistent gains from taking advantage of momentum in the market, swing trading is best accomplished by limiting your selection to stocks that have the ability to run 20-30% higher in a few weeks, rather than a few months.
Easier said than done, you might be thinking?
Not necessarily.
Read on to learn about two incredibly simple and effective formulas to dramatically increase your odds of finding stocks with explosive capability…
Formula For Fast Movers
As mentioned above, momentum swing traders must select stocks that have a healthy motor and can run 20% or more in a short period of time.
Typically, these stocks will have a low float and trade with a high ATR (average true range) relative to their price.
ATR (average true range) is a built-in technical indicator on most charting platforms that measures a stock’s volatility.
Using the ATR, we use a rather simple, yet highly effective formula to gauge whether or not a stock is “fast” enough to trade.
The formula is found by taking the stock’s 20-day moving average of price, then dividing it by the 14 or 21-day ATR.
Based on this formula, stocks that return a value of 20 to 30 are very explosive and are usually best for swing trading, especially when they are liquid (easily tradeable for individual and professional investors alike).
Equities with readings around 40 are average, while above 60 is pretty slow.
The higher the number, the slower the stock. The lower the number, the faster the stock usually moves.
The idea is to limit stock selection to those that have higher odds of making an explosive run over a short period of time.
Of course, just because you select such a stock does NOT necessarily mean it will always move faster than others, but it definitely puts the odds in your favor.
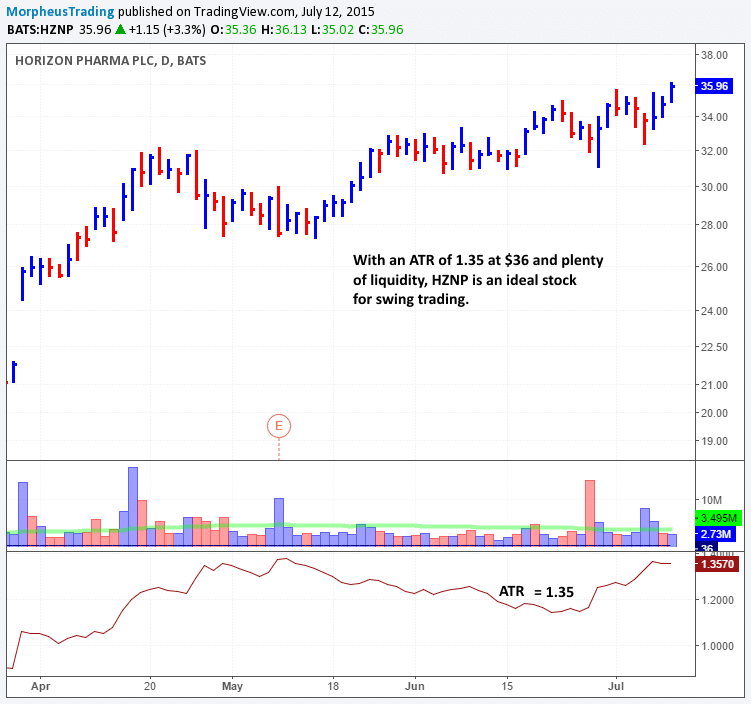
Horizon Pharma ($HZNP) is an example of a solid mover:
Liquidity Rules
Liquidity also plays a major role, as stocks with a low float and healthy ATR, along with good liquidity make the best candidates.
A simple rule for gauging liquidity is to multiply a stock’s current price by its 20 or 50-day moving average of volume.
Stocks that return a dollar value of 10 million or more are ideal, with around 10-30 million area being optimal for most candidates.
By itself, a higher reading with this formula is NOT necessarily better because although we want stocks that are liquid, we also want stocks that have explosive capability.
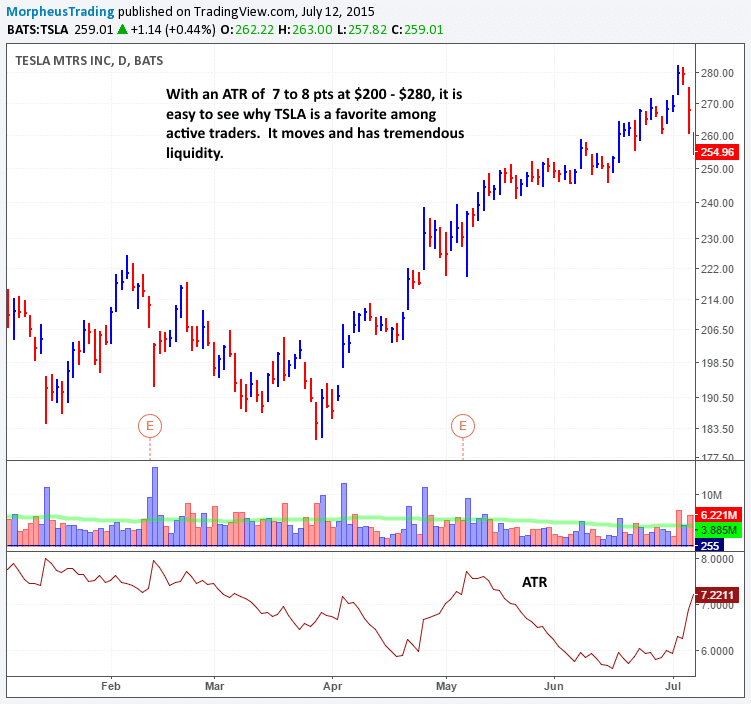
This is the reason why Tesla Motors ($TSLA) is such a desired stock on Wall Street; it is very fast and extremely liquid:
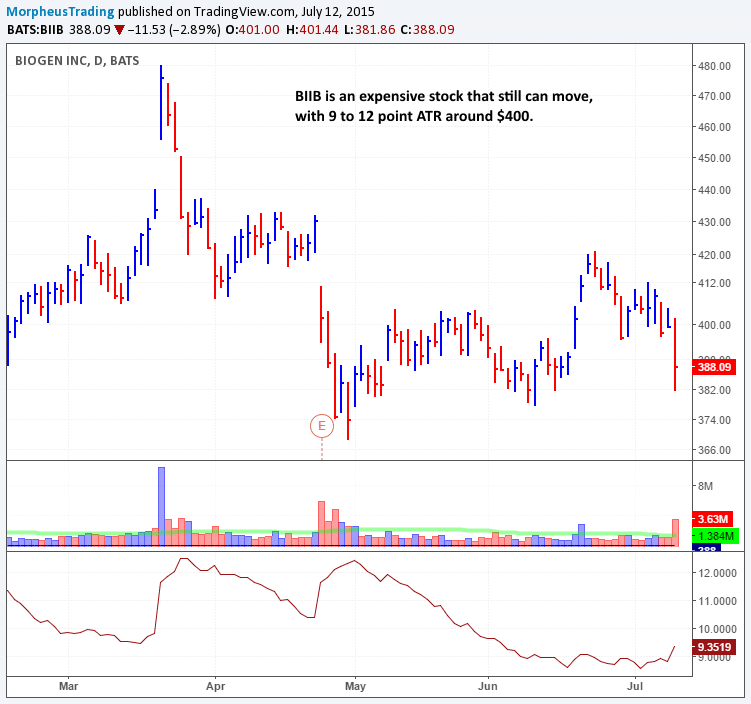
Another example of a stock with great liquidity that moves quite well is Biogen ($BIIB), as shown on the chart below:
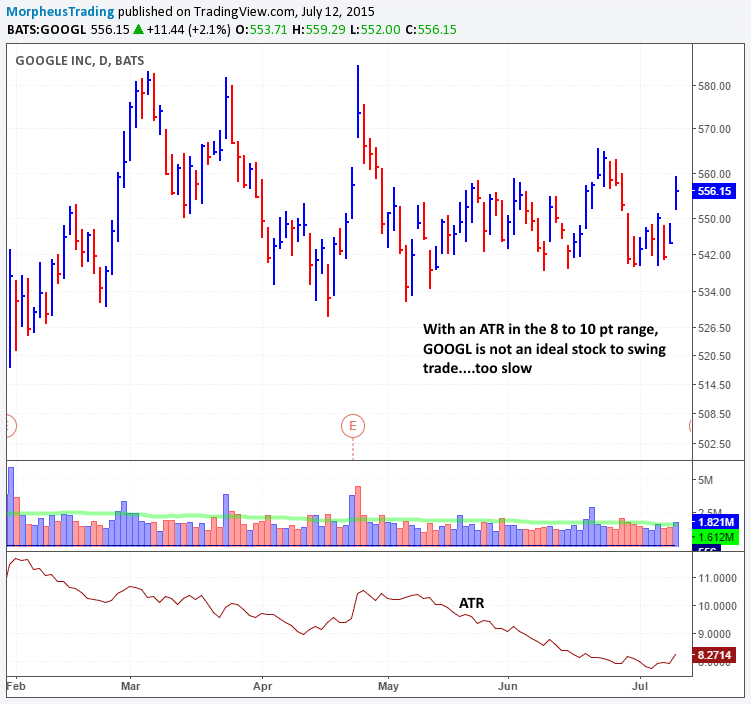
On the other hand, there are many popular stocks that are not ideal trading candidates because they trade at a low ATR relative to their price a majority of the time.
Household internet stock Google ($GOOGL) is one such example of a stock that does not meet our criteria as an ideal stock to swing trade:
After selecting stocks with strong motors and proper liquidity, the next step in our short-term stock trading scans is to verify the stocks are “in play.”
For us, that means a stock must have the following two important characteristics:
- A tight trading range or reversal candle to produce a low-risk entry point – If there is no low-risk entry point, we patiently wait for one. Such an entry may be a tight range at support of a major moving average, such as the 10, 20, 50, or 200-day MAs, or a bullish reversal candle at or near a recent swing low or major moving average.
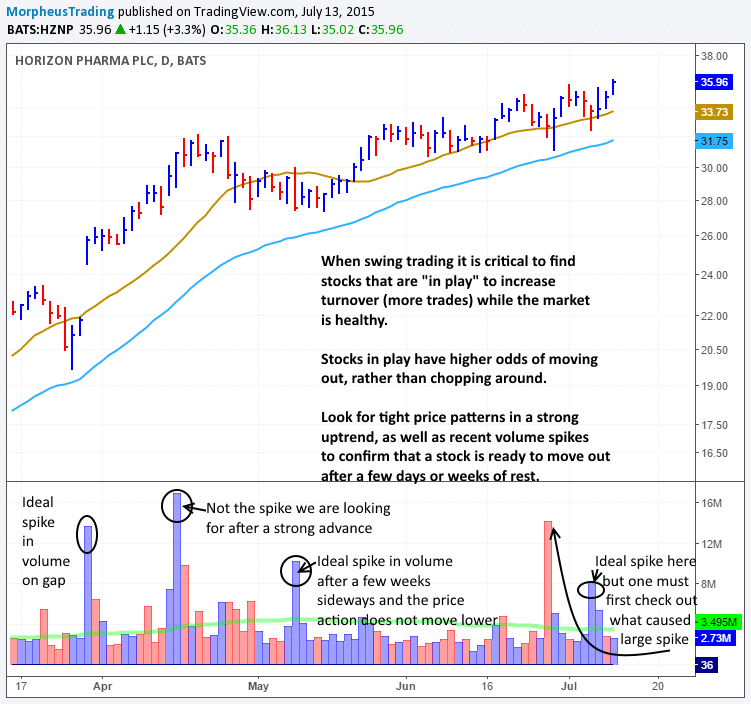
- A recent spike in volume above the 50-day moving average of volume (within the past week or two) – Generally speaking, a significant uptick in volume signals that the stock is potentially ready to resume its uptrend after a few weeks of price consolidation.
Our prior example of $HZNP works well here, as there are two quality spikes in volume.
The last spike in volume on the July 7 reversal candle was bullish, but one must also verify what produced the large spike in volume on June 26:
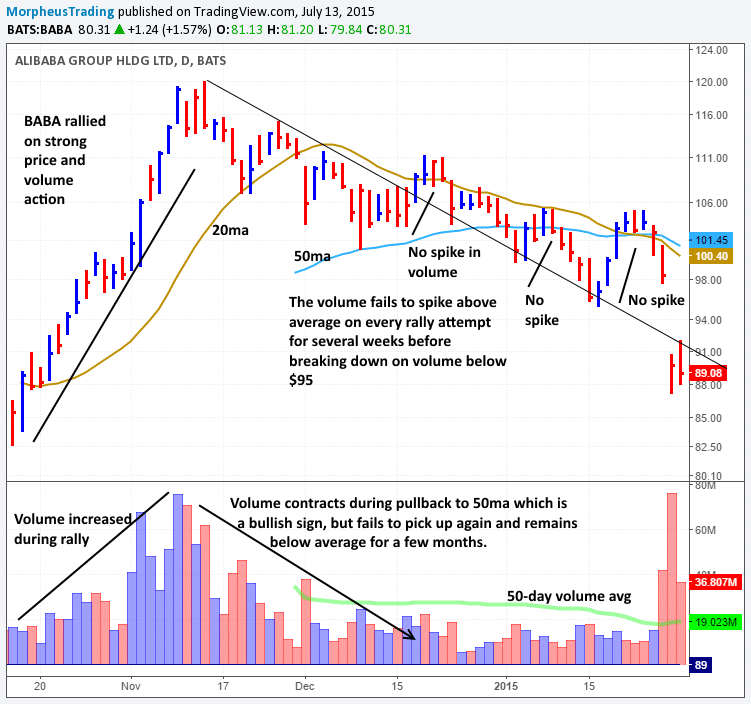
Recent IPO Alibaba ($BABA) is an excellent example of what can happen when volume does not confirm price action.
In the chart below, notice that $BABA pulls into the 50-day MA after a strong advance.
However, after holding support of the 50-day MA, it fails to produce a strong spike in volume in three failed attempts to rally before rolling over below $94.
Although a dry up in volume is a good sign, at some point volume must return to lift the stock higher:
Swing traders thrive on rotating the portfolio of stocks they trade when market conditions are strong, and proper stock selection is key to raking in the big gains thereafter.
For the most positive impact on your trading results, start immediately applying the simple concepts above (making sure the stocks belong to the strongest industry groups also helps).
And if all this sounds like just a bit too tricky to figure out, or you don’t have the time to do the research on your own, the great news is that we are already doing all the hard work for you every day!
Simply sign up now for your test drive of The Wagner Daily newsletter and you will receive the best “no nonsense” stock picks every day, complete with exact entries, stops, and target prices.

Do you pick and choose the small cap stocks based on company earnings numbers/values, or do you simple rely on the ATR number?
ATR and volume is used in determining the FIRST PASS of stocks that we will simply CONSIDER trading. But thereafter, factors such as the stock chart pattern and company earnings growth become part of the criteria for picking which stocks to swing trade. Our overall trading strategy is loosely based on CANSLIM.
I really like the part about finding stocks with strong motors and proper liquidity. In my mechanical investing screens I invest in, I have been burned in the past by stocks with low liquidity. Makes it so hard to trade and get a good entry and exit. I now stick with screens that only show good liquidity even if the backtested returns are phenomenal.
Out of interest, are there any screens you are using to find stocks with a tight trading range or reversal candle or surge in volume?
@Jeremy – Thanks for your comments. Glad you liked the article.
Yes, we scan for stocks breaking out of a tight trading range, both manually and with the Morpheus Stock Screener.
To find out more about our strategy for manually finding these stocks, check out this blog post and this one.
The article was superb, especially I appreciate one thing that usually I don’t find in other websites is the graphical representation of data. That representation makes it more easy to understand the trading strategies.
Thanks. Glad you enjoyed the article.
hi,
Im a intraday trader, could you help me identify momentum stocks on EOD…
Hello Atul,
We do swing trading, not intraday trading. However, the Morpheus stock screener can help you find high momentum stocks on EOD basis that you may be able to trade intraday. Also, The Wagner Daily newsletter offers swing trading stock picks with exact entries and exist, but again it is not intraday. Hope that helps.