 On September 22, we closed our winning trade in Lemaitre Vascular ($LMAT) for a price gain of +15.7% in our model portfolio.
Not bad for a swing stock trade…but enough about that.
Let’s get right to the technical walk-through of that profitable breakout trade, from the exact entry to exit.
Grab your notebook and pen because this post is light on the hype and heavy on the trader education. Enjoy…
Gap & Go!
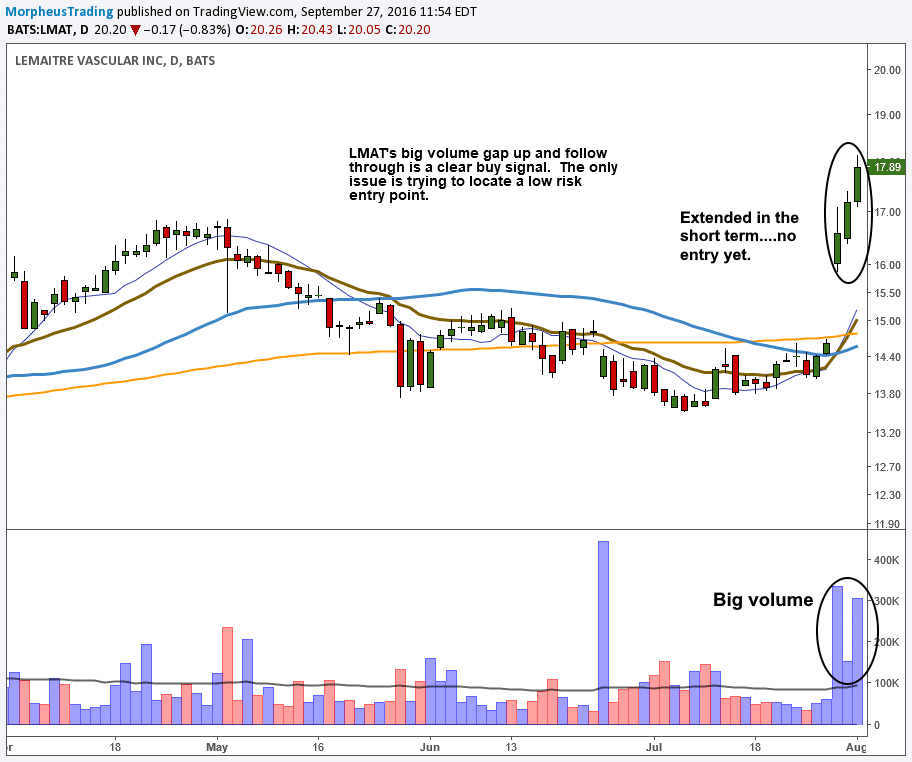
$LMAT first caught our attention as a potential swing trade on July 28, when the stock opened about 10% higher (“gapped up”) in reaction to earnings.
Since the gap occurred on volume that was three times greater than average, it was a clear buy signal for momentum trade entry.
However, after three days in a row of big gains, the price action became too extended in the short-term to provide a positive risk-reward ratio.
As such, we needed to wait for a low-risk entry point to develop:

Healthy Consolidation
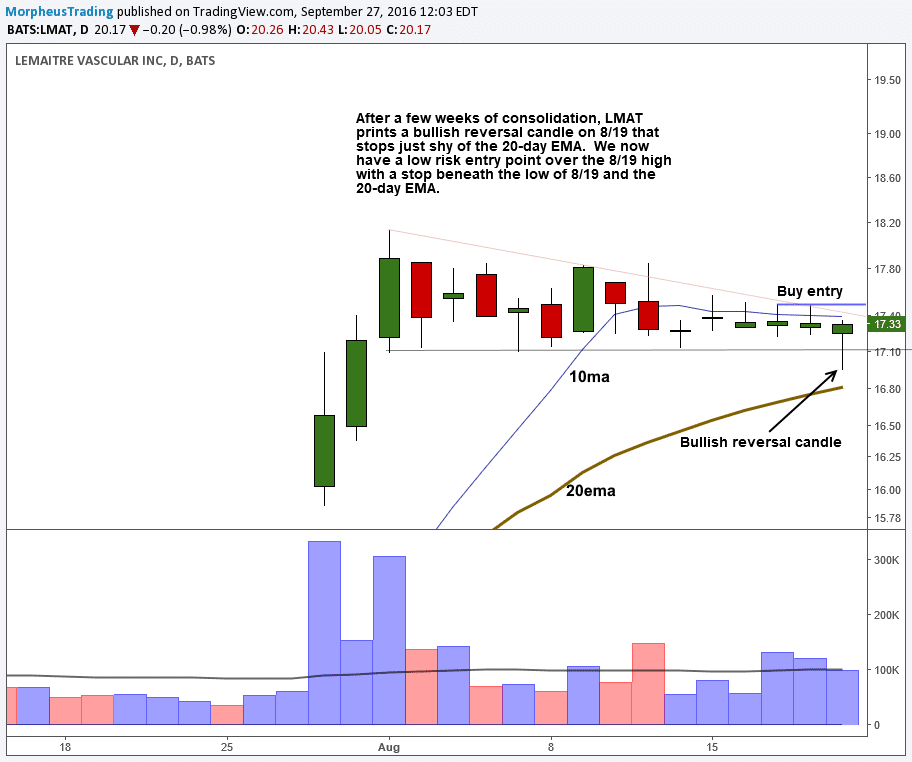
The parabolic, three-day rally was followed by three weeks of bullish, sideways price consolidation.
Sideways price action is also known as a “correction by time,” so we patiently waited on the sidelines for the ideal time to buy.
Our opportunity came when $LMAT formed a bullish hammer candlestick by undercutting the low of its range, then rallying to close near its intraday high on August 19.
It’s a bullish signal when the price of a stock dips below an obvious level of price support, but immediately snaps back above it.
When nervous investors’ stops get run, supply gets absorbed and it becomes easier for the stock to breakout of its base and resume its uptrend.
The bullish reversal candlestick (hammer) that formed on August 19 is shown on the daily chart below:

The Buy Entry
After $LMAT formed that bullish reversal on August 19, we listed the stock in that evening’s Wagner Daily watchlist for potential swing trade buy entry the next day.
The buy trigger price was $17.51, just above the high of the reversal bar.
The protective stop price was listed as $16.69, right below the low of the bar (and the 20-day exponential moving average in this case).
Here is the actual commentary that accompanied our stock pick:
After clearing the prior swing high at $17 on heavy volume, $LMAT has chopped around in a tight range around the 10-day MA. We are looking for a break of the short-term downtrend line on a pick up in volume. The stop is placed below the 20-day EMA, minus some wiggle room.
$LMAT is solid fundamentally, with three quarters in a row of accelerating, quarter over quarter EPS growth, and a 44% 3-5 year growth rate.
The Follow-Through
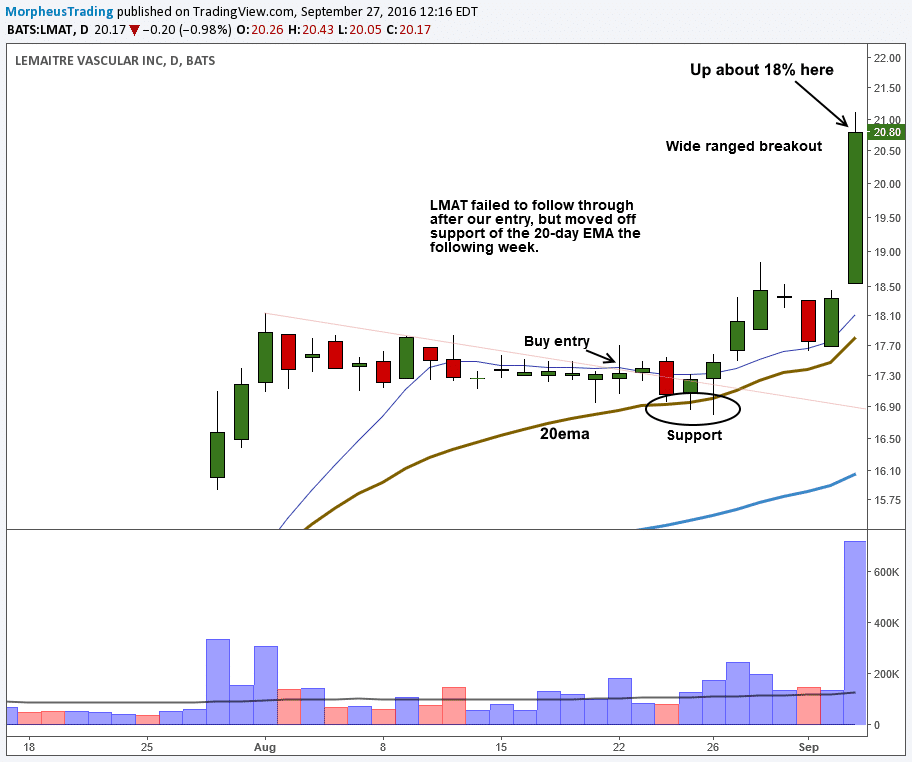
The buy entry triggered in the next session (August 22), but did not move out right away.
Instead, the price chopped around support of the 20-day EMA for a week, but never actually closed below the moving average.
After forming another hammer candlestick on August 27, $LMAT finally rallied off the 20-day EMA on higher volume (August 29 & 30):

On September 6, $LMAT had a monster follow-through breakout on massive volume that pointed to institutional buying interest.
The Exit (+15.7% gain)
After the surge of September 6, the stock was up about 18% from the August 22 buy entry in our model newsletter portfolio.
If you’re a trader who prefers relatively quick swing trades to catch a 10-20% gain, selling into strength at that time would have been ideal.
However, we were looking to hold $LMAT for a bigger gain, provided that the price and volume patterns remained bullish.
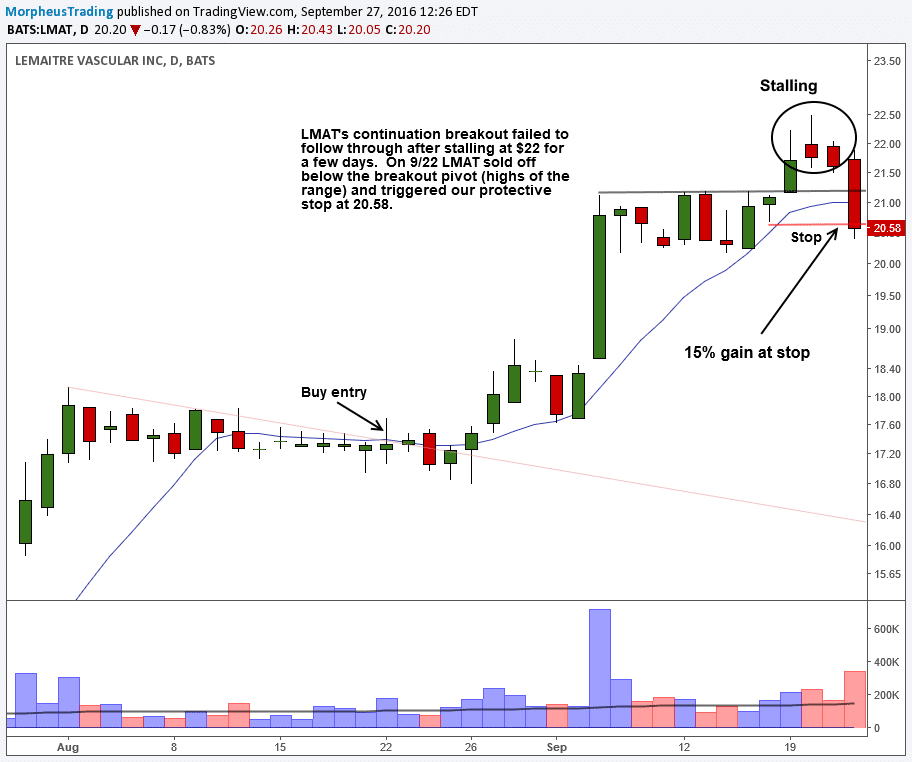
On September 19, $LMAT again broke out on a pick up in volume, but closed well off its intraday high and near the mid-point of the day’s range.
The following day, $LMAT stalled above $22, and on higher volume that hinted at stealth institutional selling into strength.
With $LMAT struggling to get above $22, we decided to tighten our stop to $20.35, just beneath the September 16 low.
The idea of raising the stop was to still lock in a gain of about 15% if the breakout failed.
As shown on the final chart below, $LMAT rolled over on September 22 (on sharply higher volume):

As shown above, we sold $LMAT for a final share price gain of +15.7% ($20.31 exit) on September 22.
Got any questions about this swing trade walk-through? Just drop us a comment below.
By the way, if you want to see this trade exactly as it appeared in our newsletter, press here to view our free swing trading archives.
