Most of the leading stocks we trade in The Wagner Daily, our nightly stock picking report, are breakouts from tight ranges near the 10 or 20-day moving averages.
These top growth stock trades are also typically within 5% to 15% of their base highs, and usually trading near their 52-week highs.
When buying this type of trade setup, we look for the price to move higher right away, or within a few days of our entry.
These types of explosive swing trades are primarily designed to work when our market timing model is on a “buy” signal and overall market conditions are strong.
However, when market conditions are not ideal and the major indices are recovering from an intermediate-term selloff, many leading stocks will have corrected 15% to 25% or more (off their highs) and not in a position to break out to new highs.
In this type of market (which we are experiencing now), we instead focus on lower-risk starter positions in stocks moving back above their 50-day moving averages (and only after the major indices stop setting lower lows).
In particular, we scan for quality, leadership-type stocks that are in a position to reclaim their 50-day moving averages after several weeks of choppy price action.
Continue reading for a clear example of how to profit from lower-risk trade entries when market conditions are less than ideal.
Etsy ($ETSY)
Prior to the Nasdaq’s recent correction, e-commerce company Etsy ($ETSY) was a leading stock that scored massive gains for our newsletter subscribers.
Like most top growth stocks, $ETSY has since cooled off and entered into correction mode.
Now, $ETSY has become an excellent example of the type of low-risk entry point we look for when buying a quality stock that reclaims its 50-day moving average.
3-step checklist for low-risk buy entries at the 50-day moving average
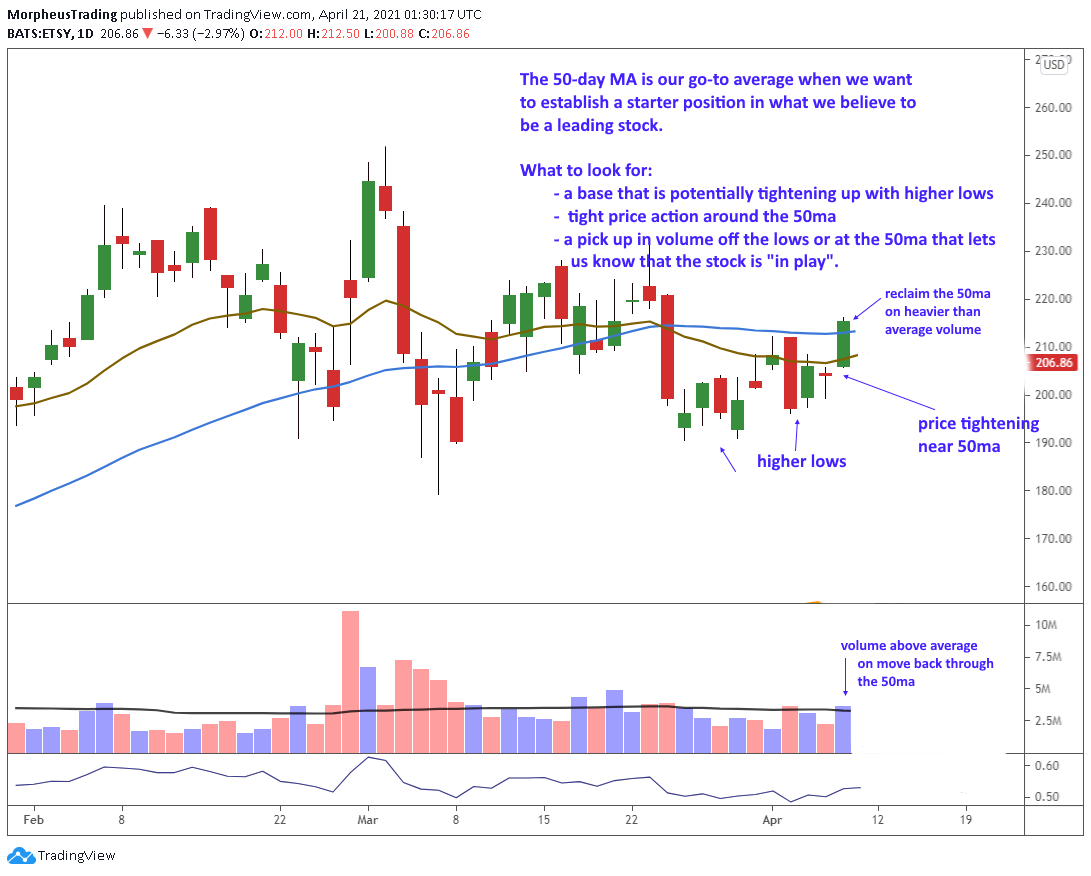
- 50-day MA crossover – Whether the chart pattern is more of a sideways consolidation (like $ETSY) or more of a cup with handle pattern, we look for an entry after the price crosses back above its 50-day MA on increasing volume.
- Higher lows – Prior to the entry, we first need to ensure that “higher lows” are already in place. This helps confirm the stock is already forming a bottom. If the stock has been correcting through sideways price action (rather than a pullback), we then look for the price swings to tighten up. In the case of $ETSY, volatility contracted right before the price reclaimed the 50-day MA.
- Volume confirmation – The actual rally through the 50-day MA is the “buy” signal, but the move should be accompanied by volume that is either greater than the prior session OR higher than its 50-day volume moving average.
The daily chart of $ETSY shows how the stock met our 3-step checklist criteria before we recently bought it:

On April 8, we bought $ETSY as a starter position in the model portfolio of our nightly stock trading report when the price reclaimed its 50-day MA (just before 12 noon).
If buying the stock on the same day it moves above its 50-day moving average, higher volume should confirm by the close.
Some stock charting platforms, such as TC2000, have a helpful relative volume indicator that displays volume as a percentage above/below average for that specific time of day.
Stop placement
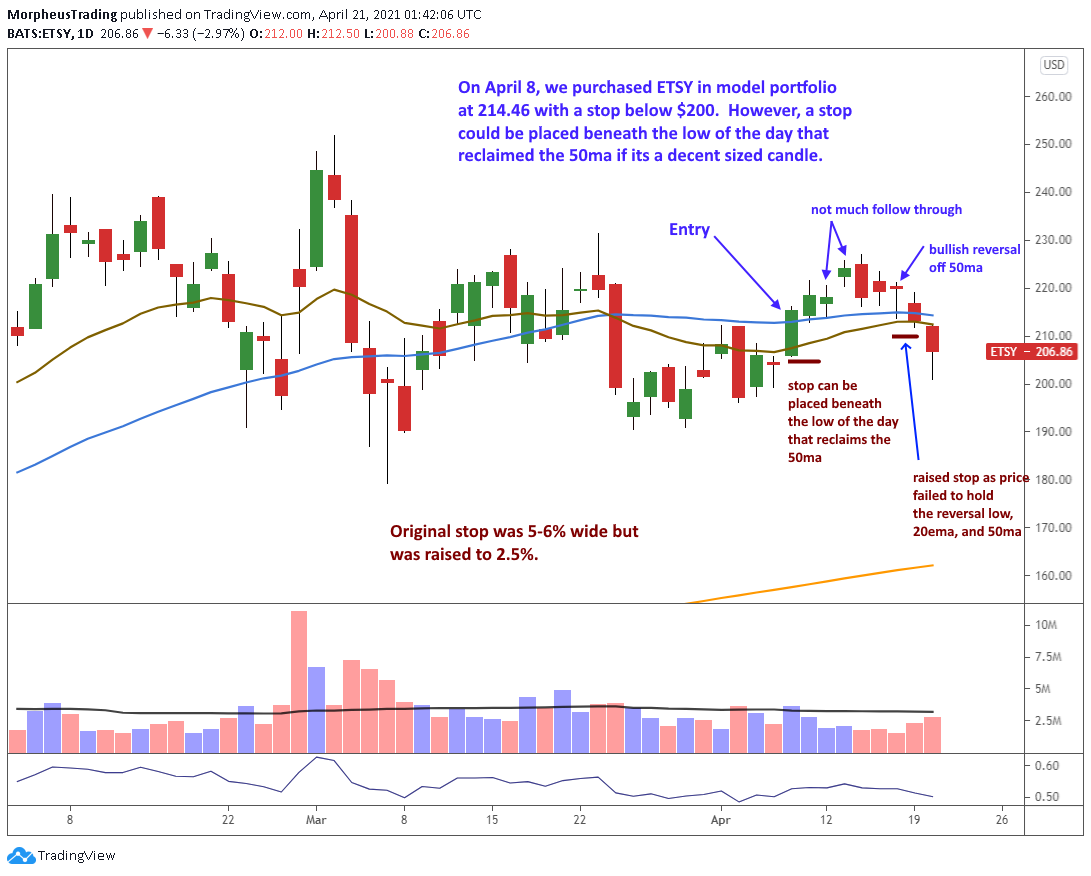
Protective stops on these types of buy entries can be neatly placed just below the low of the day that reclaims the 50-day moving average.
After a leading stock pops back above its 50-day MA, we don’t want to stick around if the price drops back below that day’s low–especially when the candlestick has a wide-ranged body that closes near the highs of the session.
With this method, the stop can typically be placed anywhere from 4% to 6% below the entry, which is usually ideal.
The $ETSY chart below shows how we initially placed our stop below the 50-day MA, then moved it higher when the rally attempt started to falter:

As annotated on the chart above, $ETSY struggled to follow through after our entry, then pulled back for a few days before bouncing off the 50-day MA with a bullish reversal candlestick.
If the stock was acting right, then it should have held the low of the reversal candle–but it did not.
The price of $ETSY opened lower the very next day, then closed below the low of the reversal candlestick and its 50-day moving average.
Because of the bearish price action, we alerted Wagner Daily members that we were raising the stop from the original price (just below $200) to the $209.89 level (below the prior day’s low, plus a bit of wiggle room).
Our protective stop triggered on April 20, knocking us out of the trade with a small -2.5% loss on a half-sized starter position.
A losing trade done right
Particularly if you’re new to trading, the $ETSY trade may seem negative because we stopped out.
However, we were able to test the waters on the long side for several days, before exiting with minimal risk due to a tight stop with only partial share size.
In the present market environment, this is actually the type of trade we will always take if possible.
Losing trades are part of the business, but properly managing losing trades is the key to protecting the bulk of your hard-earned profits from more bullish market conditions.
Stealth buy entry
Unlike buying a stock that breaks above resistance of an obvious swing high, this type of buy entry through the 50-day moving average entry does not draw much attention.
As such, these types of 50-day MA trade entries typically have some time to work before the stock hits its next resistance level.
When top growth stocks start leading the market again, we will be ready to score huge gains from explosive breakouts to new highs.
But in the meantime, we will focusing on gains from low-risk buy entries such as the 50-day MA setup detailed here.
Start your Wagner Daily subscription now to be instantly alerted to the next explosive stock pick, while learning a proven trading strategy since 2002.
