 At the close of trading on March 21, our rule-based market timing model shifted from “neutral” to “sell” mode, after previously slipping from “buy” to “neutral” mode on March 12.
When the timing system first enters into a new “sell” mode, it primarily acts as a “no nonsense,” objective way to keep us out of trouble by reminding that new buy entries do not carry positive odds of working in our favor.
In such a newly-triggered “sell” mode, we seek to increase our cash position, while also selectively shifting our focus towards trading ETFs with a low correlation to the direction of the broad market (commodity, currency, fixed-income, etc).
As a “sell” signal matures and becomes more confirmed by time and price, short selling of weak stocks also becomes part of the trading plan, but for now it is still too early to enter new short positions for momentum swing trading.
Static Cling Of The 50-Day Moving Average
Despite weakening performance in leading stocks and recent broad market distribution (higher volume selling) that sparked the new “sell” signal, it’s important to note that both the S&P 500 and Dow Jones Industrial Average are still trading firmly above key, intermediate-term support of their 50-day moving averages.
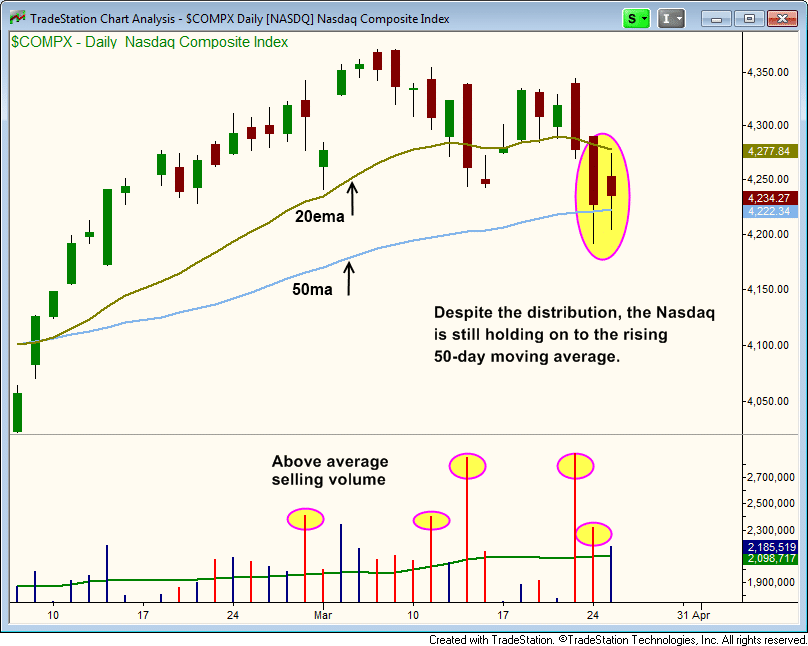
On the other hand, the NASDAQ Composite has clearly begun showing relative weakness to the S&P and Dow, but has yet to breakdown below support of its 50-day moving average:

On both March 24 and 25 (circled in pink), the NASDAQ “undercut” support of its 50-day moving average on an intraday basis, but still managed to close each trading session above it.
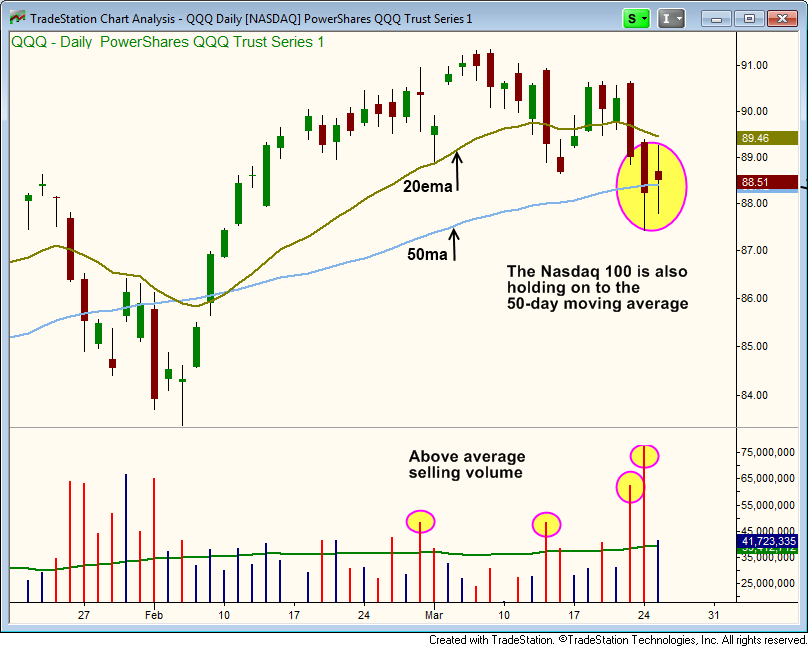
It’s a similar technical picture in the NASDAQ 100 Index (the large-cap brother of the NASDAQ Composite).
Below is the chart of PowerShares QQQ Trust ($QQQ), a popular ETF proxy for the NASDAQ 100 Index:

Since banks, mutual funds, hedge funds, and other institutions frequently utilize program trading to buy pullbacks to the 50-day moving averages, it was not surprising to see buyers stepping in each time the NASDAQ brothers neared that pivotal price level in recent days.
Biotech Blues
One of the biggest anchors holding the NASDAQ down over the past week has been heavy selling pressure in the market-leading biotechnology index.
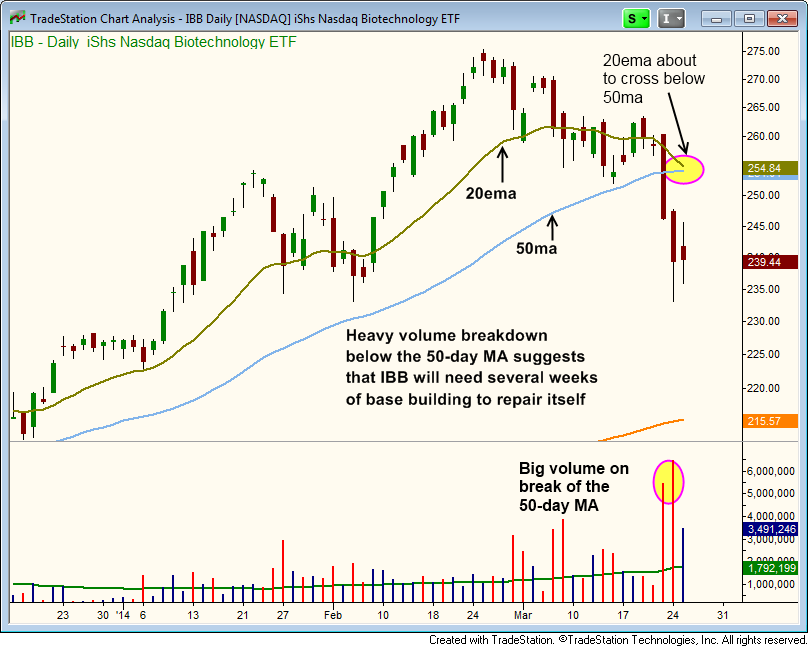
Between just two recent trading days (March 21 and 24), iShares NASDAQ Biotech Index Fund ($IBB) plunged 10%.
More concerning is that $IBB sliced through its 50-day moving average with ease, as volume surged higher as well:

Because biotech has been one of the strongest industry sectors for many months of the current bull run, it will be important to see how $IBB reacts in the coming weeks.
While $IBB may be able to manage a short-term bounce from its current level, the technical damage has already been done and $IBB will need at least a few weeks (possibly months) to clean itself up.
Sector Rotation Keeping The Fire Burning
While leading stocks in the NASDAQ have broken down, energy and financial related stocks have held ground, allowing the S&P 500 to outperform the NASDAQ lately.
Large-cap (blue chip) stocks have recently begun leading the stock market, as evidenced by recent breakout action in energy and financial stocks.
Energy stock Haliburton ($HAL) set a new all-time high within the past two weeks, while Schlumberger ($SLB) is attacking its highs of 2011.
Even the $IBM dinosaur woke up a few days ago by ripping through major price resistance at $190 on big volume.
Base On Base Ain’t Bad
A base on base chart pattern occurs when the price action of a recent breakout is unable to extend much beyond the highs of the prior base (former resistance), but also doesn’t give up much ground.
The lows of the new base that forms should hold at or above the highs of the prior base, giving that “base on top of a base” look.
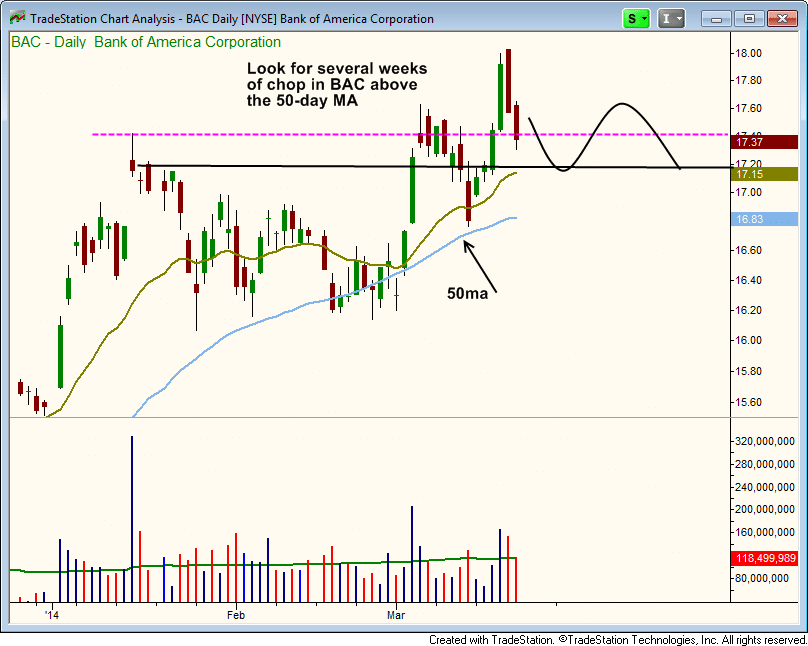
One example of a possible base on base in the works can be found in the following chart of Bank of America ($BAC).
At the beginning of the month, $BAC was close to breaking down below its 50-day MA, but has since broken out to a fresh 52-week high.
Although the breakout hasn’t been explosive in terms of extending much beyond the highs of the prior base, $BAC may simply chop around for several weeks, forming a base on base type pattern while the broad market consolidates:

Like $BAC, the Financial SPDR ETF ($XLF) also broke out to new highs and stalled out:

With $XLF, last Friday’s false breakout above the prior swing high suggests the price could be headed for several weeks of chop, which could potentially form another base on base pattern if the ETF holds above its 50-day moving average.
While it is encouraging that select blue chips are valiantly fighting to push higher with base on base patterns, you still must not forget that the recent pullback in the NASDAQ has forced the top leadership stocks to pull back to support of their 50-day moving averages.
Leading stocks like $TSLA (we are still holding with an unrealized gain of 48%), $FB (we recently sold for a 49% gain), and $KORS must hold on to their rising 50-day moving averages/10-week moving averages to keep the dominant stock market rally alive.
Most tech leadership stocks of the NASDAQ have been hit hard over the past several sessions, and will need at least a few weeks of basing action in order to produce low-risk, reliable buy entry points.
Here’s The Plan, Man!
With our market timing system (click here for an overview) in “sell” mode, our near-term trading plan is to lay low and see how the market responds to recent selling in the coming days.
If new buy setups develop down the road, we can certainly add some long exposure to our stock and ETF portfolios.
If, for example, the NASDAQ continues holding above its 50-day moving average over the next one to two weeks, our timing model could easily return to “buy” mode (especially if leading NASDAQ stocks rip higher after testing their 50-day moving averages).
But for now, there still isn’t much to do on the long side without pushing it.
Conversely, if market conditions continue deteriorating, we will eventually visit the short side of the market.
Yet, there is no need to rush into short selling right now.
Patience and discipline is the key to preserving profits in markets that are indecisive and/or in transition.
Without much effort, anyone can be a rock star in a parabolic bull market!
But what separates the professionals from amateurs is knowing when to take your foot off the gas pedal.
Clearly, right now is one of those moments.
To be instantly alerted when it’s time to drop your foot back on that gas pedal by receiving access to our best stock picks and market timing model, subscribe now to The Wagner Daily newsletter.
