 When I was a new trader and missed the chance to buy the breakout of a hot stock I had my eyes on, I used to get rather upset and frustrated with myself.
After all, I felt I was truly missing out on a great opportunity to profit from momentum swing trading.
But I eventually learned that buying breakouts is definitely not the only way to make money in a bull market.
The beauty of my trading system is that it allows for buying a pullback whenever strong breakouts are not bought for any reason.
When buying a pullback that follows a breakout, the profit is obviously slightly lower than if the buy entry occurred immediately on the rally above price resistance.
However, the positive trade-off is that buying pullbacks is often lower-risk than buying breakouts because there is a lower risk of the breakout failing.
In this blog post focused on trader education, I walk you step by step through how I recently scored a solid gain by buying the first pullback of a strong breakout stock.
FLEXing The Breakout Muscles
Last month, Flextronics ($FLEX) emerged onto our internal radar screen as a potential swing trade buy entry for subscribers of The Wagner Daily.
Here are the main reasons we liked the stock for potential breakout buy entry:
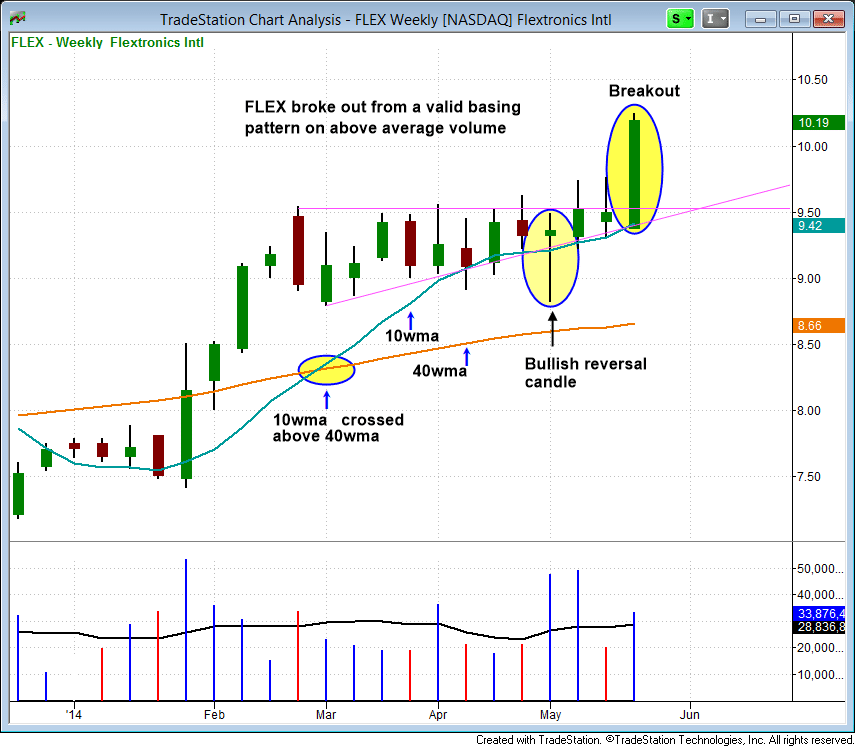
- $FLEX rallied through 40-week moving average (similar to 200-day moving average) in late January and early February, then formed a tight-ranged, 11-week consolidation near its 52-week high (after stalling at $9.50). The push back above the 40-week moving average was also on increasing volume.
- The 10-week moving average (similar to 50-day moving average) crossed up above 40-week moving average, which is a bullish trend reversal signal.
- The 10-week moving average caught up and provided support as $FLEX began to build a constructive base.
- On May 2, there was a “shakeout” candlestick that turned into a bullish reversal because the price closed near the intraday high. Such an intraday shakeout absorbs overhead supply by causing the “weak hands” to dump their shares at the first hint of risk, thereby clearing the way for a subsequent advance.
- $FLEX broke out from the base of consolidation on higher than average volume, closing near the highs of the week.
- We missed the breakout entry point in our newsletter, but there was no need to panic; rather, we simply waited for a low-risk pullback entry to emerge.
Each of the technical factors above are shown on the weekly chart below:

Since the breakout from a solid base of consolidation was quite valid, I began stalking the stock for a potential pullback entry because odds favored the breakout leading to another leg higher within the developing uptrend.
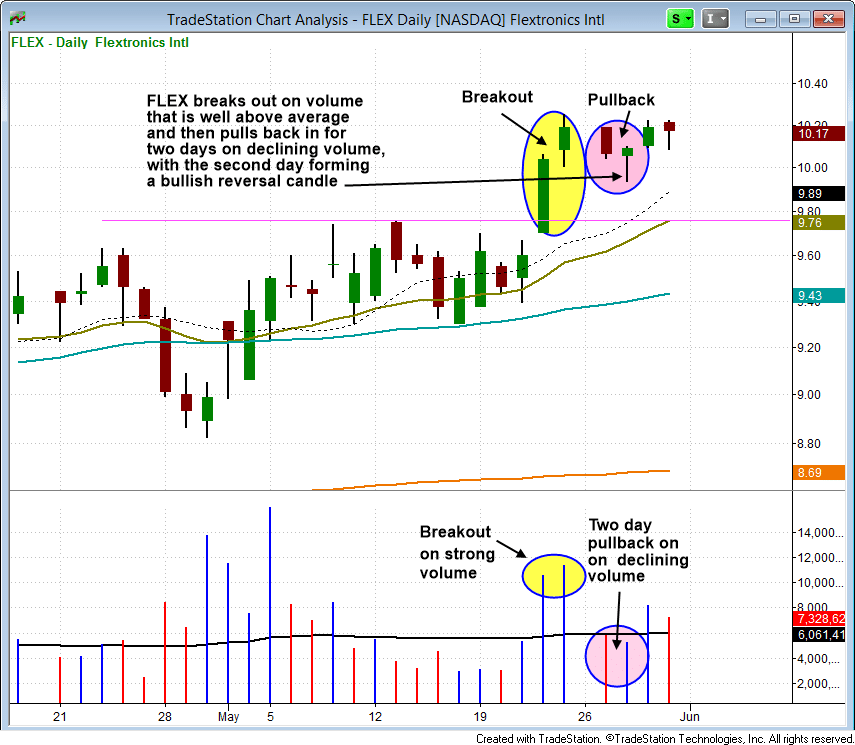
Zooming into the shorter-term daily chart time frame below, notice that $FLEX broke out on better than average volume, then pulled back for two days on declining volume (lighter volume on the pullback is bullish). On the second day of the pullback, the stock formed a bullish reversal candle, which is shown below:

On the chart above, notice the second day of the pullback “undercut” support of the two-day low, but reversed to close near the highs of the session, and above the prior day’s low. This was a bullish shakeout on lighter volume, indicating that most of the sellers are now gone.
The following day (day 3 of the pullback), volume picked up and price moved higher.
On day 4 of the pullback, the price once again dropped lower intraday (testing the prior day’s low), then reversed to close near the intraday high.
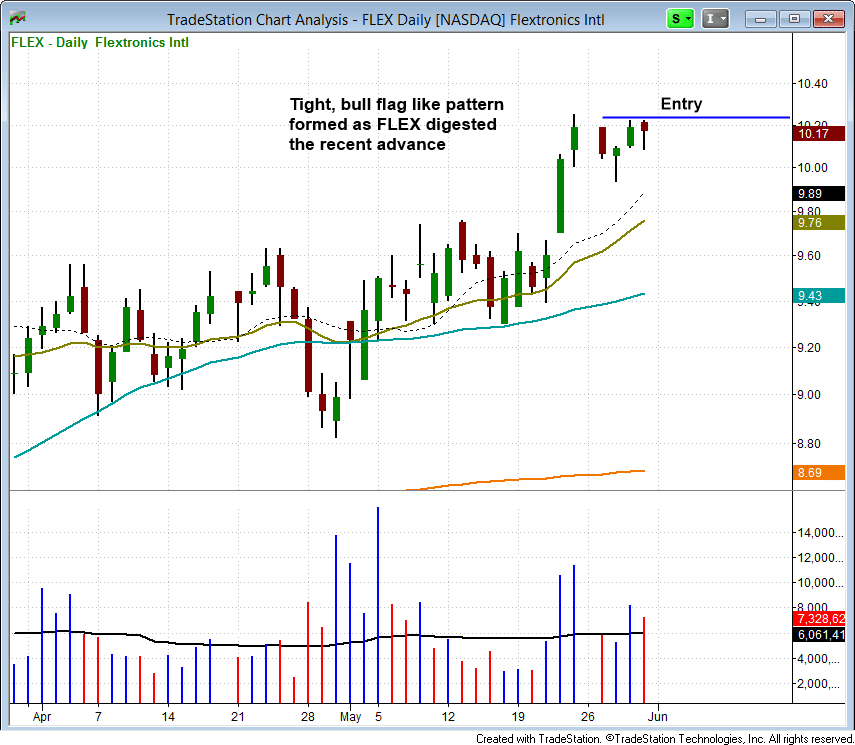
After four days of tight price consolidation that followed the breakout, $FLEX was now correcting more by time (consolidating) than price (retracing lower). This led to the formation of a bull flag type pattern.
On the fourth day sideways, $FLEX formed an inside day, presenting our subscribers with a low-risk buy entry over the five-day high.
As such, I listed $FLEX in in the following day’s stock pick newsletter (evening of May 30) for potential buy entry IF the price rallied above the two-day high (marked by the blue horizontal line on the chart below):

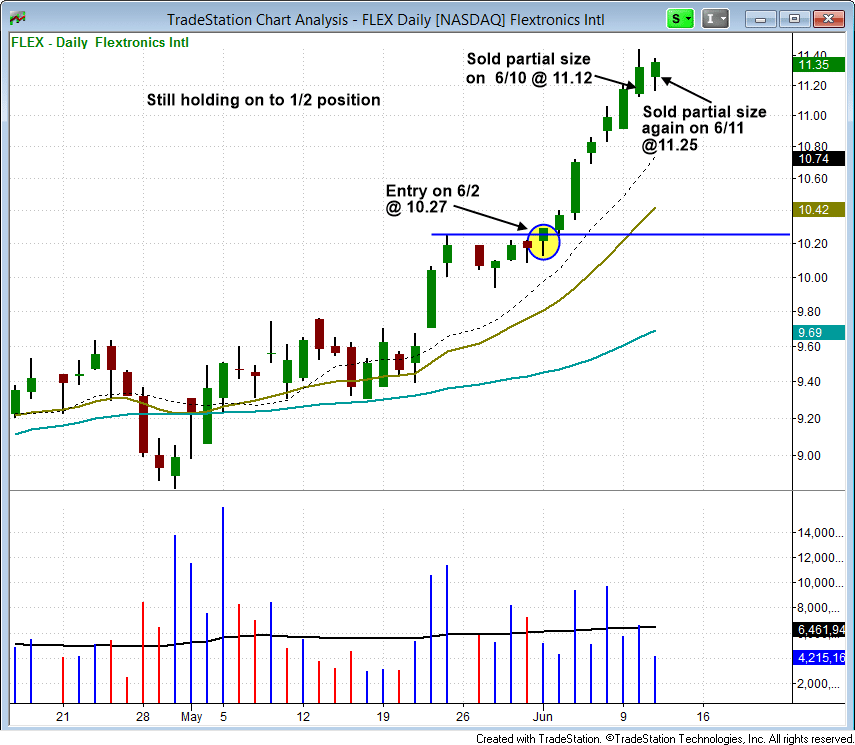
As anticipated, the trade setup triggered for buy entry the next day (June 2).
After a few days of higher closes on light volume, $FLEX finally followed through to the upside (on June 4), with a strong 3.2% advance on volume that was 50% greater than average. This volume spike was important, as it pointed to institutional accumulation.
The annotated chart below shows the actual buy entry point in my newsletter, as well as the two price levels at which I scaled out of the trade into strength (about one week later):

Partial share size was sold on June 10 (at $11.12), while more shares were sold the following day (at $11.25).
The average sell price of those two exit points equated to a net share price gain of 8.9% with a holding period of just over a week.
Now What?
In my Wagner Daily newsletter, my model stock picking portfolio continues to hold 50% of the shares from our original June 2 buy entry.
The plan with the remaining shares into sell into strength of the next leg up (planning for an exit around the $12-$13 area).
If all goes according to plan (which is obviously never guaranteed), it will equate to a 20%-30% share price gain from our entry point, which is the approximate return I seek to achieve with most of my short to intermediate-term momentum swing trade entries.
If you enjoyed this article, please share with your favorite social network by clicking the icon on the left. Comments are always welcome too!

What’s the difference between a blast off setup and a pullback. They look pretty similar to me as we are interested in volume spike in both.
Hello Hari,
For further details and clarification between the two, please check out the article on this page:
http://www.morpheustrading.com/best-stock-trading-strategy
Hope that helps.