 Successful swing traders know that winning stock chart patterns repeat themselves over and over again.
As such, you can easily gain valuable knowledge by occasionally taking a retrospective look at “what worked well” with your recent winning trades.
In this blog post, I walk through the “before” and “after” stock charts of two winning trades that were recently closed, as well as one open position that is looking good.
Specifically, I review the exact entry and exit points of $AMD (bull flag breakout), $PLNT (cup & handle), and $LNN (flat base), exactly as previously detailed for subscribers in The Wagner Daily newsletter.
Grab a notebook, pen, and your favorite beverage, then kick back and keep reading to expand your knowledge and maximize your swing trading profits.
Advanced Micro Devices ($AMD)
-
Bull Flag Breakout
-
+14% gain over 2-week holding period
-
Bought 11/29, Sold 12/14
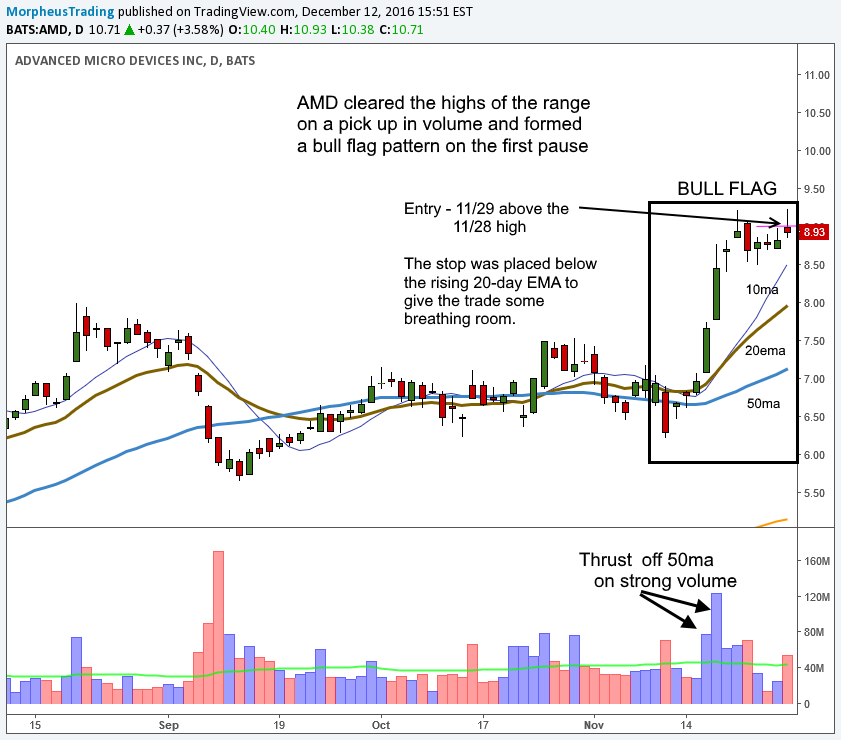
After thrusting off support of the 50-day moving average on heavier than average volume, $AMD formed a bull flag continuation pattern.
To confirm a bull flag, we look for declining volume while the flag is being formed near the top of the range.
Lighter volume during consolidation is bullish because it indicates traders are holding onto their gains, rather than selling into strength of the preceding rally.
In the November 29 issue of our swing trading newsletter (sent to subscribers the evening of November 28), we listed $AMD as a potential buy entry above the November 28 high.
$AMD triggered our buy entry on November 29, when the price moved above resistance of the previous day’s high.
The daily chart of $AMD below shows the bull flag pattern that enabled us to list the stock as a Wagner Daily buy setup:
Bull flag breakouts are momentum-driven, so we typically look for the price action in a bull flag pattern to move sharply higher within just 5 to 10 days of our buy entry.
However, after buying $AMD on November 29, the price failed to follow-through right away and closed well off the highs of the session.
This led to a two-day pullback that found support just above the 20-day exponential moving average (a reliable indicator of short-term support).
We stopped out of partial share size just beneath the November 29 low, but the stop on the remaining position (below the 20-day EMA) gave the trade some breathing room.
After two days of consolidation, $AMD finally cleared the swing high, with strong volume, on December 6.
The breakout after the shakeout prompted us to re-enter the shares we previously stopped out of the following day.
This time, $AMD followed through with the bull flag breakout and zoomed over over the next few days.
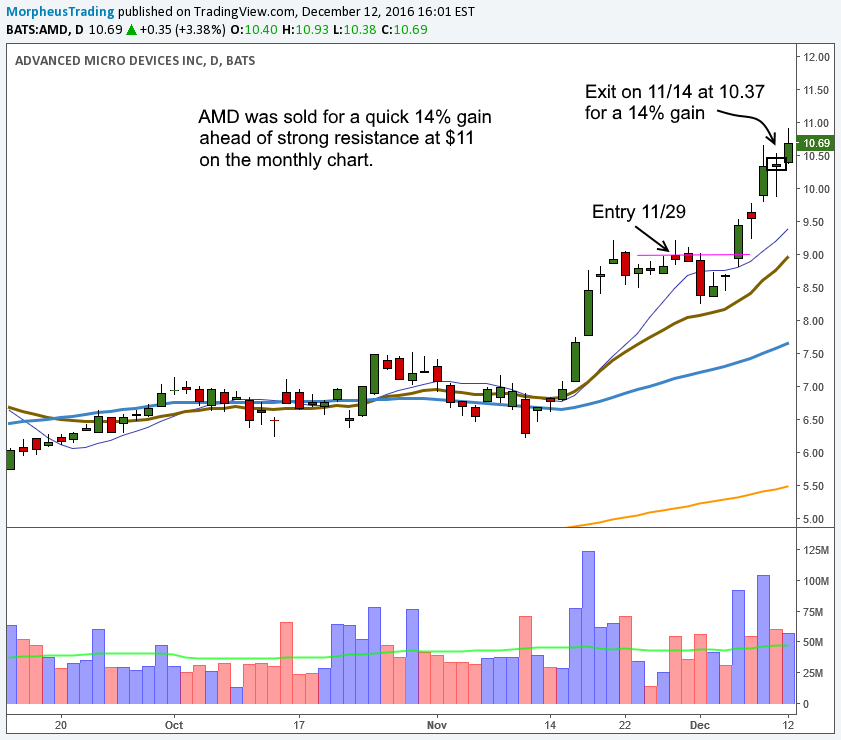
Since we knew there was major resistance in $AMD around the $11 level (see a monthly chart), we decided to lock in the solid gain, rather than trying to squeeze every penny out of the advance.
As such, we alerted subscribers to exit the position on the December 14 open and netted a 14% gain on the initial entry, with a 12% gain on the shares that were re-entered.
The entry, exit, and overall price action described above can be seen on the daily chart of $AMD below:
Planet Fitness ($PLNT)
-
Cup and Handle Breakout
-
+13% gain over 1-week holding period
-
Bought 11/08, Sold 11/14
One of our favorite chart patterns is the cup and handle, a bullish pattern that precedes some of the most powerful and reliable breakouts.
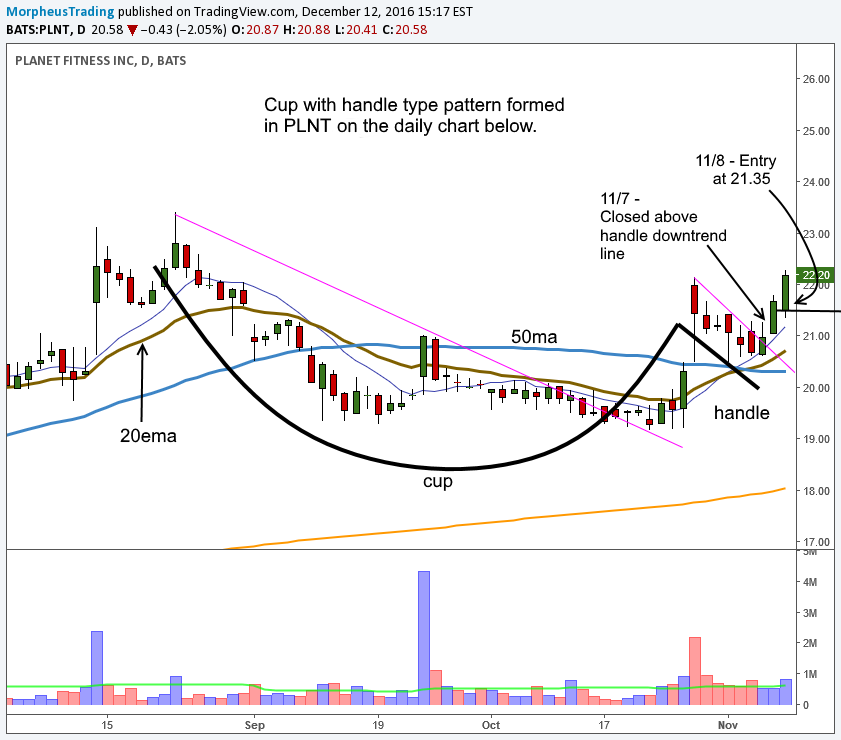
As shown on the stock chart below, $PLNT formed a cup and handle from late August to early November of this year.
The “handle” of the pattern formed from October 27 to November 8, with the price action finding support at the rising 20-day EMA and 50-day MA (around $20.50).
Our signal to list $PLNT as a potential setup in our stock trading newsletter came on November 7, as the price rallied above the short-term downtrend line (upper channel of the handle).
When we spotted this, we placed a buy limit order to enter $PLNT on a slight pullback to $21.35 in the following session.
The chart below shows the cup and handle pattern, as well as our subsequent buy entry on November 8:
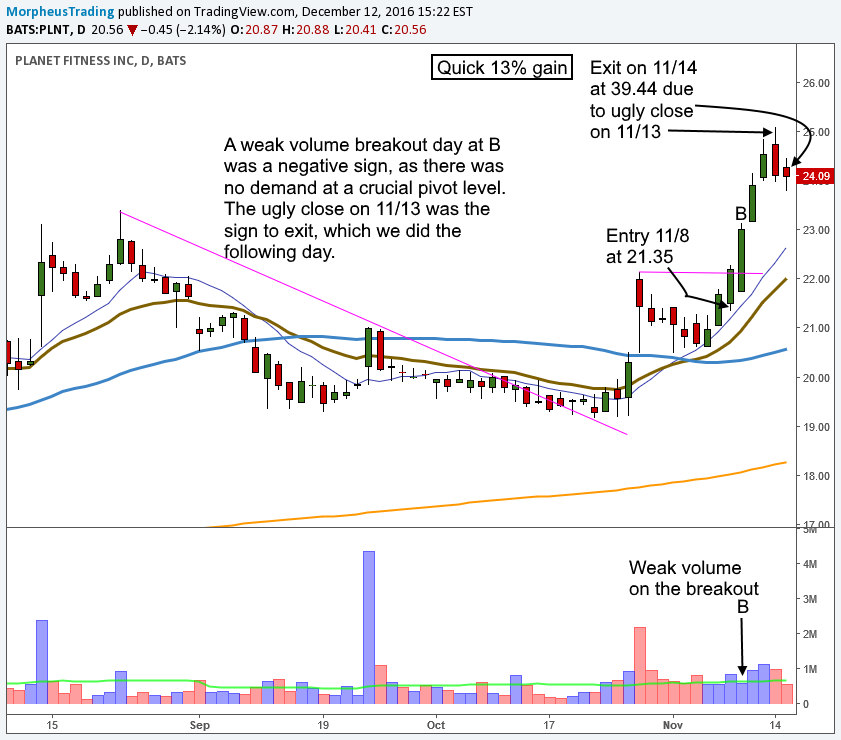
$PLNT immediately surged higher after our buy entry, breaking through the high of the handle and giving us a nice profit buffer of 4% just one day after our entry.
However, volume failed to confirm the bullish move because turnover was lighter than the previous day and well below average.
Because of this apparent lack of demand at a critical pivot point, we decided to treat $PLNT as a quick momentum swing trade, rather than holding on to the position for a bigger core gain over two to three months.
We sold $PLNT at $39.44 on the November 14 open, due to weak volume on the breakout and the ugly reversal candle that formed on November 13.
The chart below shows the price action after our buy entry, as well as the exit that locked in a 13% gain over just six sessions:
Lindsay Corp ($LNN)
-
Flat Base Breakout
-
Bought 11/23 (still open)
Unlike $AMD and $PLNT, our trade in $LNN remains an open long position in The Wagner Daily model portfolio.
The long-term monthly chart below caught our attention at the time of buy entry, as there were two failed bases leading to the third base of consolidation:
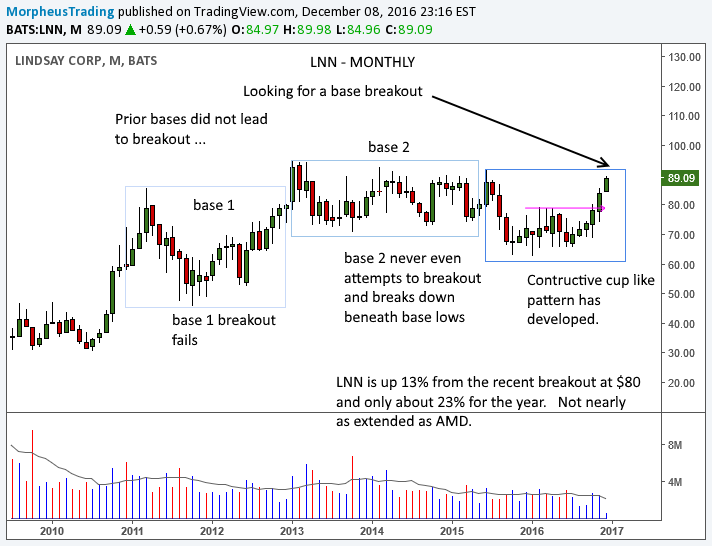
Many new and experienced stock traders spend way too much time scanning for new trades on the daily chart timeframe.
Although the daily chart is useful for seeing short-term trends, trade setups on the monthly timeframe can be more explosive, especially when they align with bullish price action on the weekly and daily chart intervals.
The high volume gap up in mid-October was an extremely bullish signal, which led to several weeks of tight basing action around the rising 20-day EMA and above the rising 50-day MA.
On November 21, we alerted Wagner Daily subscribers that we were placing a buy stop to enter $LNN above the highs of the range.
That setup triggered for “official” buy entry on November 23, and we remain long the position.
Our plan is to hold $LNN through any short-term pullbacks, in anticipation of a 30%-40% on this core trade:

Through 14 years of experience since Morpheus was founded in 2002, we have been tweaking and fine tuning our winning stock trading strategy.
But rather than seek the elusive holy grail of trading, we simply focus on mastering the nuances of the most basic, yet highly reliable and profitable chart patterns.
The bull flag breakout ($AMD), cup and handle ($PLNT), and flat base breakout ($LNN) are three of our most frequently traded chart patterns.
If you wish to learn more about any of those patterns, click any link in the sentence above.
To profit from the best stock picks while also learning a “no nonsense” trading strategy that simply works, sign up now for your test drive of our nightly stock pick newsletter.
