 Stock traders who focus on trading only the most obvious chart patterns are missing out on huge gains that more subtle patterns can provide. Here’s an excellent winning trade example of how you can profit by being open-minded in your analysis.
Most traditional investors who get inflicted by the exciting “swing trading bug” get started by purchasing buy one or two trading books about technical analysis.
Popular stock trading books typically share much of the same basic content, such as what a bullish chart pattern should look like.
When we began publishing The Wagner Daily newsletter way back in 2002, our trading system was loosely based on the teachings of William O’Neil’s How to Make Money in Stocks, an incredible book that tops the list of required reading for all new traders.
This classic trading book focuses on several key price patterns a trader must learn to identify in order to profit from the stock market, such as the cup with handle pattern.
These reliable chart patterns explained in O’Neil’s book are a fantastic starting point for all traders because they add much-needed structure to a chaotic stock market.
Identifying Subtle Bullish Chart Patterns
Over time, traders will eventually come across stocks and ETFs that break out and explode higher from a chart pattern that was not obvious.
For example, a stock breaks out from a base of consolidation and rockets higher, despite not ticking all the boxes for what a bullish chart pattern typically looks like.
Of course, having an objective, clearly defined set of trading rules is crucial for your long-term trading success.
However, too much rigidity in your chart analysis can cause both new and experienced traders alike to miss out on profitable trading opportunities in the more subtle patterns.
Keep reading for an actual, recent example of a winning stock trade that we could have easily missed if our trading system was too rigid.
Smacked In The Face With A Bullish Signal
In our November 21 blog post, we walked through a winning swing trade in CRISPR Therapeutics ($CRSP) that led to a whopping +24% gain for Wagner Daily subscribers over a two-day holding period.
But the subtle chart pattern that preceded our buy entry required a bit of an open mind.
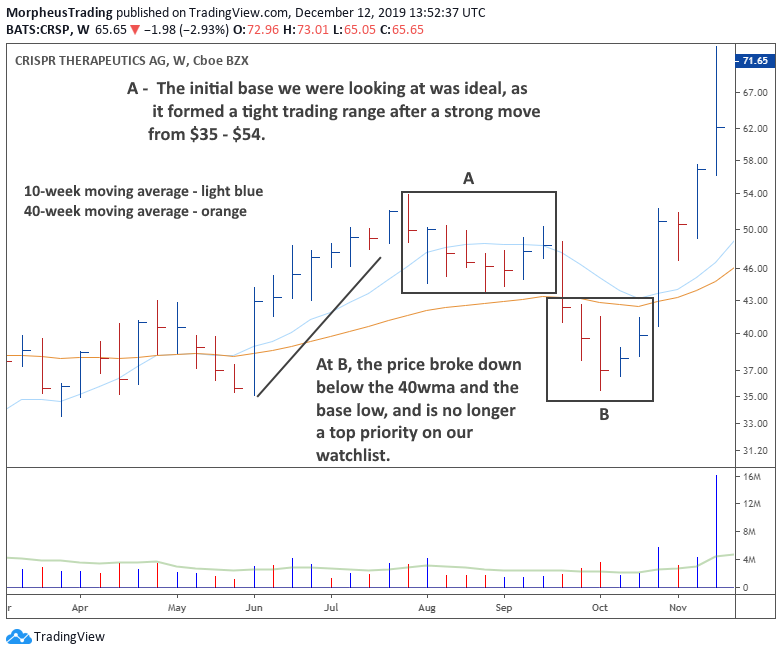
Although the weekly chart of $CRSP initially formed a bullish pattern, it subsequently broke below key support levels that invalidated the previous bullish setup:

CRISPR Therapeutics fell below key support of its 10 and 40-week moving averages in the area labeled as “B.”
However, notice that $CRSP suddenly exploded 30% higher in one week of late October.
Most importantly, the rally was confirmed by volume that surged to more than double the average weekly level (green line shows average weekly volume).
This powerful sort of price and volume action after a “failed” bullish pattern is unusual and should smack traders in the face!
Answer The Door When Opportunity Knocks
When such a monstrous, high-volume surge like the one in late October swiftly grabs your attention, the next step is to look for a healthy pattern of tight price consolidation that holds above the rising 10-day moving average.
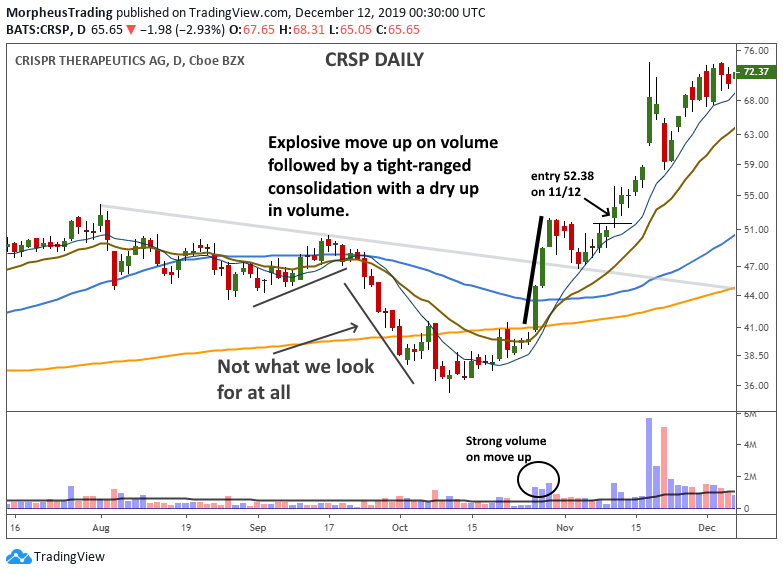
Drilling down to the daily chart interval below, notice the late October rally enabled $CRSP to break out above resistance of the downtrend line (grey). Higher volume also confirmed the move.
However, the preceding base of consolidation was funky.
It was not a flat base or cup with handle pattern–it was just a 12-week long pullback that dipped below the 200-day moving average. Check it out:

We probably would have passed on buying this stock and missed the second wave up IF we would have only focused on the price action to the left of the strong advance.
However, by continuing to monitor $CRSP on our internal watchlist, we saw the tight consolidation that followed the rally and held above the 10-day moving average.
As such, we alerted subscribers of our swing trading report that we were buying the stock on November 12 at the $52.38 area.
With two separate exit points, we subsequently locked in an average gain of +20% on this swing trade that we held for only a few days. See further details about this winning trade in our previous blog post here.
An Open Mind Opens Opportunities
The reason less obvious chart patterns can have such monstrous rallies is because less traders are expecting the stock to move higher in the first place. In turn, this builds momentum as traders later jump on the bandwagon.
Classic chart patterns are quite important and we still love to trade common flat base or cup with handle patterns. Again, How to Make Money in Stocks is an excellent starting point to learn basic chart patterns (especially if you are new to trading).
But after nearly 20 years of experience perfecting the Morpheus trading strategy, we have learned to keep an open mind by not forcing every single trade to fit into some specific pattern in order to buy it.
This is especially important when we see unusual price and volume action that smacks us in the face, as Crispr Therapeutics did with its more subtle chart pattern.
What do you think about keeping an open mind with your trading strategy? Drop us a line and let us know your thoughts below.
