 In a recent blog post, I explained and illustrated how intraday moving averages can be used to improve your stock picking accuracy.
Since I received a lot of positive feedback on that post, I penned this follow-up article to build on that mini-lesson by drilling down to focus on just one intraday moving average in particular.
This incredible intraday indicator helps you quickly and easily do three things well:
- Measure the true momentum of a rally in any stock, ETF, or index
- Remain confident when holding stocks pulling back from their highs (to reap greater trading profits)
- Assists you in knowing exactly where to set protective stop prices with your trending swing trades.
Want to know more?
Just read on to discover the power of the 20-period exponential moving average on the hourly chart (hereinafter 20-EMA).
Amazingly Quick and Effective Check
Over the years, I have found the 20-EMA to be an excellent tool for assessing just how bullish any rally really is (the 10-day MA also works in a similar fashion).
Simply put, it is tough to question the strength of a rally when the price of a stock/ETF/index is steadily trending higher and above a rising 20-EMA.
It works so well that I am confident (but never backtested) that you have at least a 50% chance of a winning trade if you buy a stock exclusively because it is trending higher while holding above its 20-EMA on the 60-minute chart.
Such price action shows the bulls are clearly in control.
Conversely, a slip below the 20-EMA within a rally is frequently a warning signal of a possible correction by time or price.
Shakeout Or Breakdown?
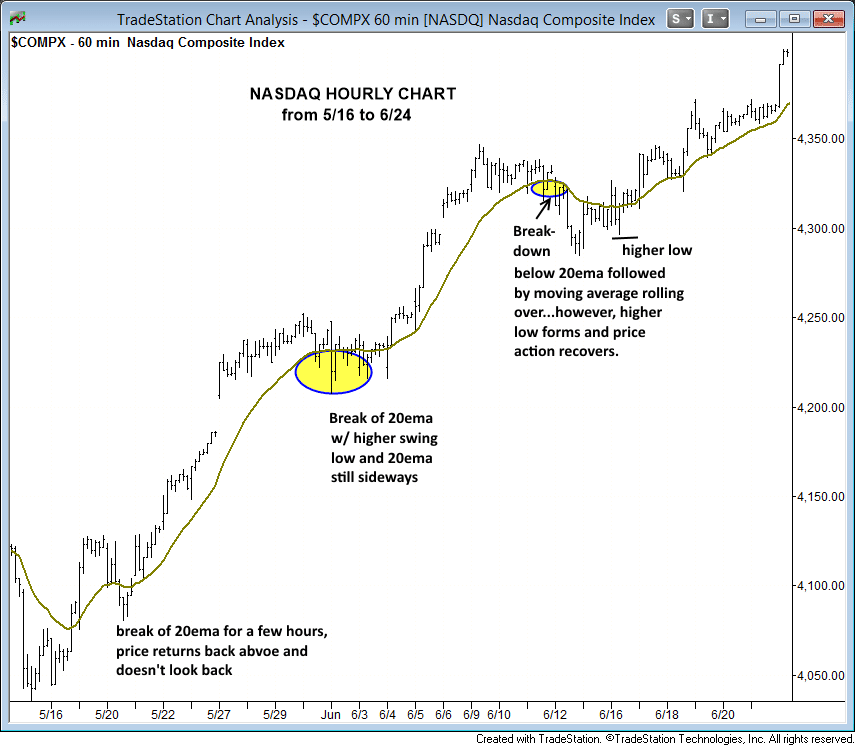
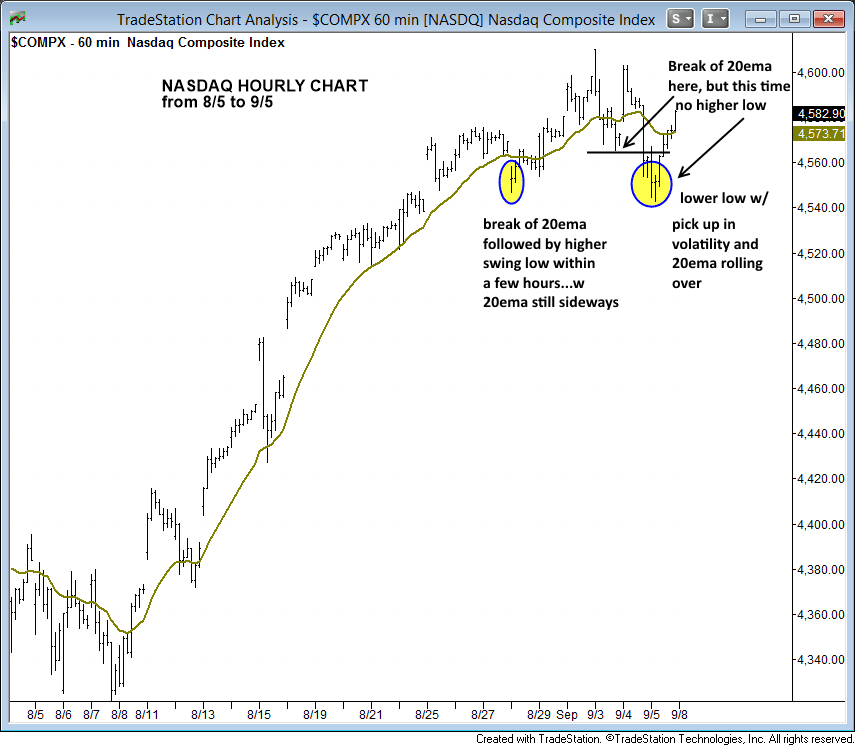
If the move below the 20-EMA was just a minor shakeout, then the price action should reclaim the 20-period EMA within a few hours to a few days, or at the very least set a higher swing low below the 20-EMA.
Smaller shakeouts will usually recover back above the 20-EMA within a few hours, which causes the 20-EMA to flatten its trend, but avoiding rolling over.
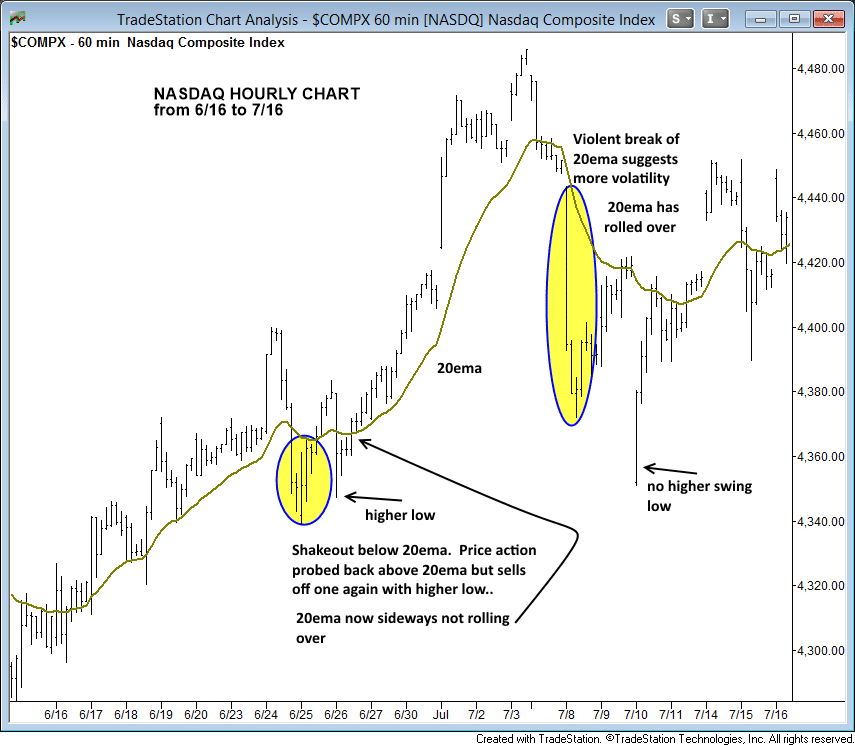
However, when volatility picks up and there is a severe breakdown below the 20-EMA (1% or more for an index, 2% or more for a stock), the 20-EMA will usually break its uptrend and roll over.
Accordingly, price action frequently becomes quite volatile, with multiple crosses above and below the 20-EMA over the next few days.
Show Me, Don’t Tell Me
Rather than rambling on about the specifics of the relationship between price action and the 20-EMA, it is better to show you a few annotated charts that do all the talking.
Below are three hourly charts of the NASDAQ Composite, spanning from mid-May of this year to the start of September.
On each chart that shows several weeks of trading within an uptrend, pay close attention to how the price action reacts as it comes into contact with the 20-EMA:


A Closer Look
When you learn how to interpret subsequent price action that follows the touch of a 20-EMA, this stellar indicator can be used by swing traders as the proverbial “line in the sand” for knowing whether or not a trend is maintaining very bullish momentum.
For example, a break below the 20-EMA, followed by sideways price action, and then a return back above the 20-EMA (while it trends sideways) is merely a shakeout that should not bother a trader who is seeking bigger gains with a longer holding period.
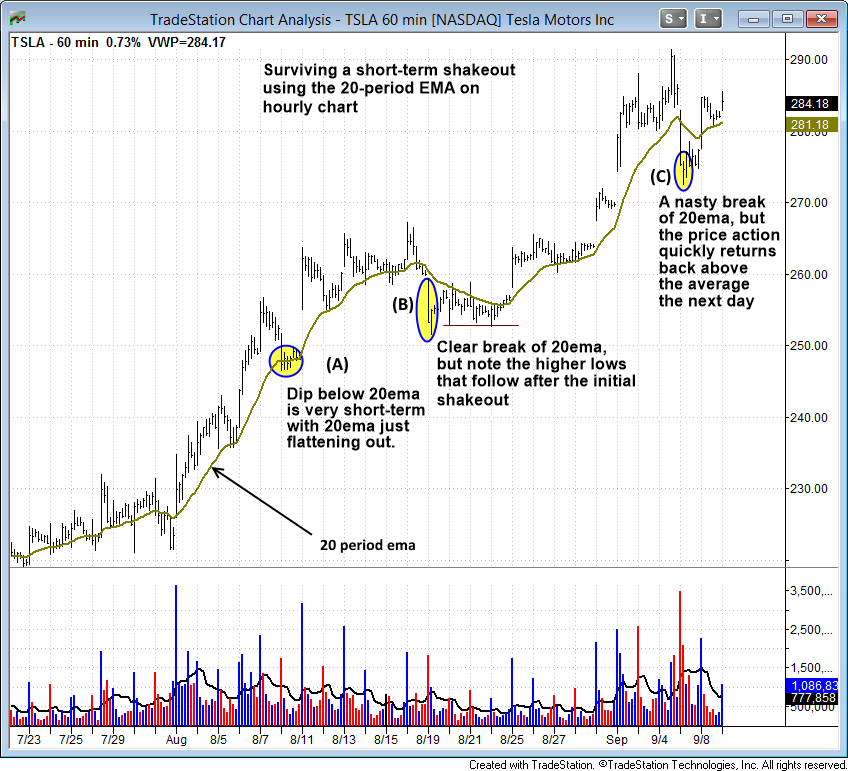
This type of shakeout price action is shown as point “A” on the hourly chart of Tesla Motors ($TSLA) below:

At point “B”, there is a much clearer violation of the 20-EMA, which causes the moving average to roll over as well.
Yet, if you are a swing trader looking to maximize profits, holding onto a winning position through a break of the 20-EMA is a necessity; otherwise you will continuously cut your profits short.
Even at point “C,” $TSLA is once again under pressure with a nasty break of the 20-EMA.
However, after the initial sell-off finds traction, the price quickly reclaims the 20-EMA the next day and pushes higher (which is exactly what I like to see).
Short-term Shakeouts
Whenever a stock or index breaks down below the 20-EMA and quickly finds support, the price action should snap back above the 20-EMA the next day (points “A” and “C”) OR at least form a “higher low” on the hourly chart the next day (point “B”).
Short-term shakeouts, such as those shown at points “A” and “B,” tend to last an average of just 1 to 3 days.
But if a stock or index trades below the prior day’s low (on the next day following a break of the 20-EMA) and continues lower after the first opening hour, the price action may be headed for a deeper correction that could lead to a longer consolidation period.
Another Tool In Your Arsenal
Despite my previous implication that a trader may even be able to be profitable using the 20-EMA along, you should not look at the 20-EMA on the hourly chart as some kind of magic indicator that will instantly cause you to become the greatest trader in the world.
Rather, the 20-EMA is a very helpful tool, just like several other reliable technical indicators used in the stock and ETF trades of my nightly swing trading newsletter (try it risk-free for the first 30 days).
Any indicator that helps remove human emotion from a swing trade ultimately increases your trading profits, and the 20-EMA on the hourly chart certainly fits the bill.
I would love to hear YOUR thoughts about the 20-EMA. What do you think? Drop me a comment below.

Hello! This use of hourly EMA 20 is really interesting. Look at Nasdaq/QQQ when it turned up October 2002 and again March 12th 2003! March 10th 2009 – and April 16th 2014. I use $NYAD, $VIX and CMF (Chaikin), in addition to Parabolic and 65 days EMA for my trading. Confirmation of the direction with these vehicles in combination with hourly EMA 20 seem to be a strong combination.
Thanks a lot!
Hey Harald,
Really pleased you found the article helpful. Thanks for your feedback and best wishes in your trading.
Deron
Hi Deron,
Thanks for sharing the information this is very useful especially in handling emotions and to take appropriate decisions by not getting scared with the shakeout candle.
Can this technique be used for EoD stock charts as well.
Thanks.
Yes, the technique can be used EOD as well, as the 20-day EMA works in a similar fashion (just on a longer timeframe).
Thanks a ton for sharing such helpful article with us..I was facing same problem from long time and finally got solution for the same 🙂
Hey Alonzo,
Great, glad you liked the article. Thanks for your feedback.
Deron