The Wagner Daily – January 18, 2022
Below is the full, archived issue of The Wagner Daily swing trading report (sent to members the night before the publication date).
Subscribe now for your access to the best stocks for swing trading, proven Morpheus stock trading strategy, and market timing model with a 20-year track record.
Just drop us a comment with any questions or comments–we’d love to hear from you!
The Wagner Daily – January 18, 2022
Proven swing trading strategy, top ETF & stock picks, and market timing model…since 2002
MTG Market Timing Model – sell for Nasdaq and S&P 500 ( very tactical market )
Our timing model was designed to keep our trades in line with the prevailing market trend, not to call tops or catch bottoms in S&P 500 or Nasdaq Composite.
today’s watchlist (potential trade entries):

closed positions:

position notes:
- Per intraday alert, covered $MSFT and $FIVN due to reversal action in the markets.
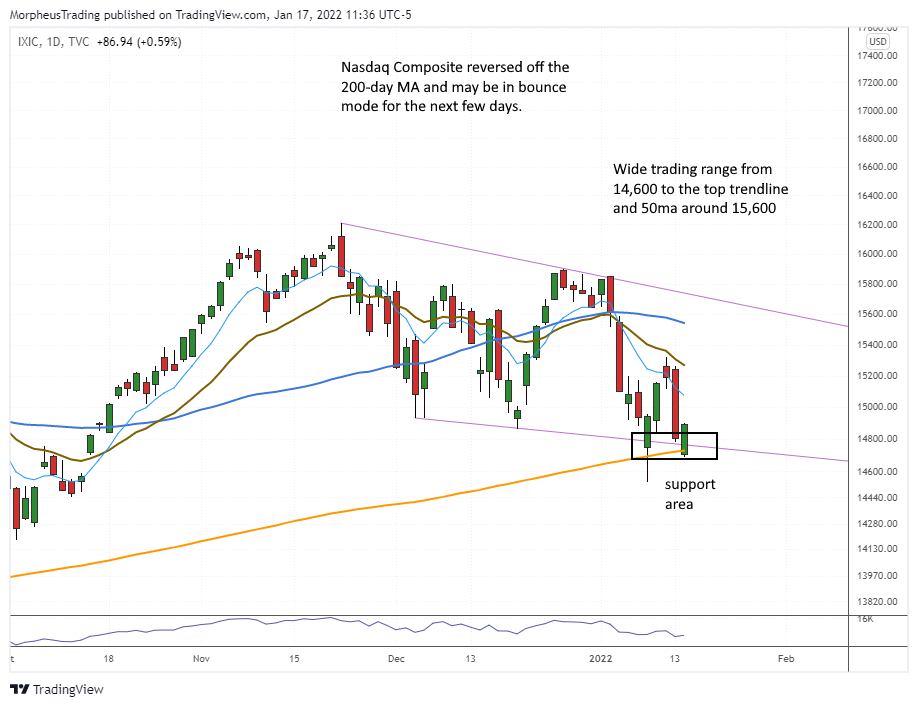
The Nasdaq Composite bounced off support of the 200-day moving average for the second time last Friday and may be due for a short-term rally. There is resistance from the 20-period EMA on the hourly (14,933-ish), 10-day EMA (15,121-ish), and 20-day EMA around 15,275.
The Nasdaq is in a downward trending channel with support at the 200-day MA and heavier resistance at the 50-day MA and top trendline, which makes for a 5-6% wide trading range. With the 50-day MA on the Nasdaq basically flat and starting to turn down a bit, we could be looking at one big chop fest with a rally back up to the 50-day MA or top trendline a possibility.
Can the 200-day MA hold? If so, then we’d look for higher lows to print over the next few weeks.
Rallies into the 20-day EMA could lead to decent short setups in some of the weaker industry groups.

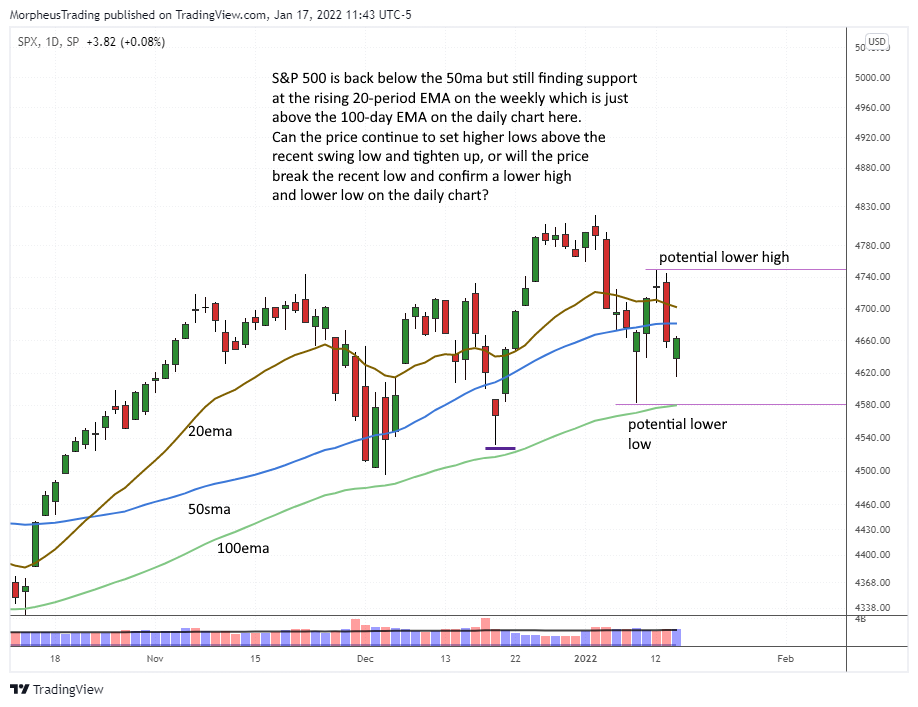
The S&P 500 is back below the 50-day MA but holding on to the 20-week EMA or 100-day EMA on the daily chart. Not much to say here as the index remains in a series of higher highs and higher lows. A break of last week’s low would confirm the first lower high and lower low. Leadership is thin and not improving, especially if financials follow through to the downside after last Friday’s gap down.

Growth has taken a beating the past few weeks but could be due for a bounce if $IWP can hold last Friday’s low, which undercut the prior low. Like the Nasdaq, we would expect any bounce to be shortable.

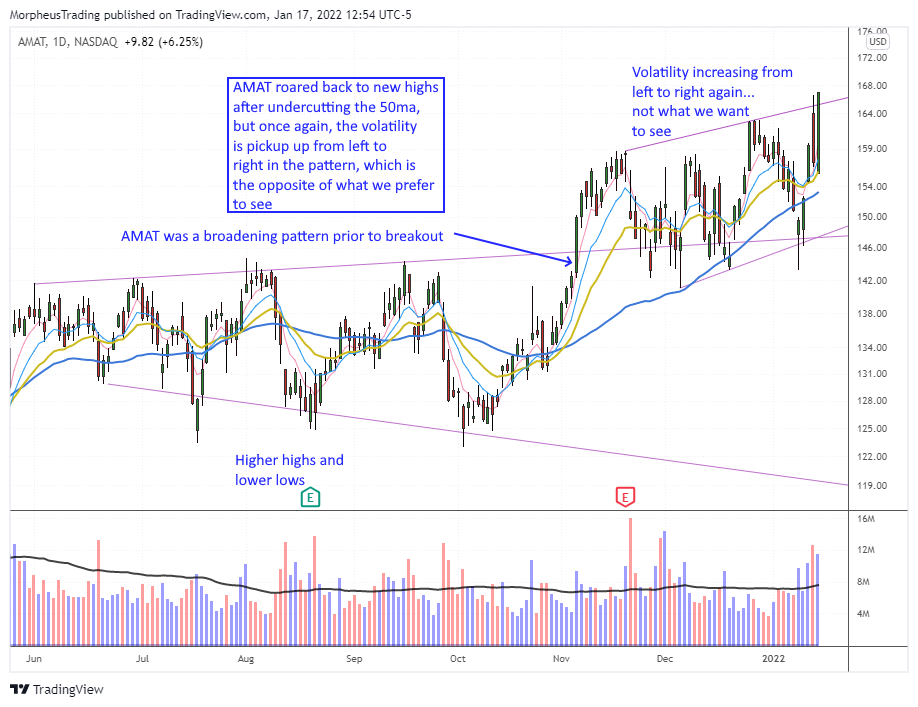
A few semiconductor stocks have held up really well near all-time highs but the price action isn’t ideal. $AMAT closed above range highs after a wild week of trading. While the reversal was impressive, the chart has seen a pick up in volatility from left to right as it did earlier in the year before breaking out. Generally speaking, volatility should dry up from left to right when looking at a bullish chart. Tough to trust this action so no entry here.

Our weekend scans did not reveal much in the way of low-risk buy points on either side of the market. Most quality shorts have already sold off and need a 2-3 day bounce to produce short entries. On the long side, there is very little out there. Energy remains strong, but most leading stocks in this sector are extended from the 20-day EMA.
$LYV reversed off the 50-day MA last Friday and could be in play over the day’s high and 20-day EMA this week with a little help from the market. This is not an official setup.

Other stocks that could be in play for a quick pop over the prior day’s high: $F $JXN $CF $KBH $WGO $EXPE
Per intraday alert, the model portfolio covered both short positions in $FIVN and $MSFT for a quick gain to guard against a possible reversal in the market. There are no new official setups for Tuesday. Market conditions remain very challenging for the intermediate-term trader, as most trades setups as of late are 2 to 5 day holds at best.
Let’s see what develops during the next few days.
Unofficial Setups – For experienced traders only, no guidance is given for these setups.
- none
See you in the chat room,
Rick
For those new to this report, our share size is pretty conservative with max. size around 10% of equity per trade. We do this because we prefer to trade 10-12 names to keep the report active. However, if your goal is to maximize returns, taking 18-25% positions is the way to go. If trading in a non-margin account, this will limit the portfolio to 4-5 positions. If on margin, then 8-10 positions. Our risk per trade on average is just over 1/2 of 1%. Experienced traders may want to risk 1% to 2% per trade. For example, a 20% position in a 100k account with a 6% stop loss would result in a $1,200 loss (1.2%).
Start my Wagner Daily membership now to start receiving winning Morpheus stock trade signals, including a stock portfolio you can easily follow. The Wagner Daily PRO includes live swing trader room for daily, real-time trade ideas and powerful stock trading education.

