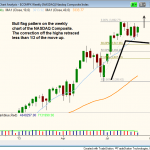
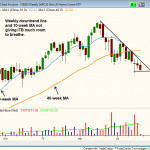
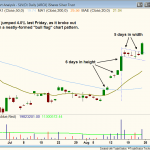
Taking a look at the weekly chart, we see the NASDAQ forming a bull flag pattern. The run up off the lows in July created the flag pole, and the current sideways action is forming the flag. The tight consolidation has retraced less than 1/3 of the last wave up, which is what we like to see on bull flag patterns (should not retrace more than 33% to 38% of last move up). The pole was created in six weeks, so the breakout from the flag should go in 5-7 weeks (we are currently on week 5).
The energy sector has held up well during the market correction. With crude oil, solar, oil and gas exploration, and oil services all showing tight price action on the weekly chart. iShares U.S. Oil & Gas Exploration & Production ETF ($IEO) has been trading in a tight range for several weeks, just below the highs of the current base. On the weekly chart, we see the price action tightening up while holding above the rising 10-week moving average. We placed $IEO on today’s watchlist, looking for a potential breakout to new 52-week highs within the next few days.
After a false breakout to new highs in mid- to late July, Guggenheim Solar ETF ($TAN) has formed a six week base, with the lows of the current base finding support at the highs of the previous base, around $26. $TAN also held support from the rising 10-week MA in August. There were a few shakeouts, but the price action never closed below the 10-week MA. $TAN has held up well the past few weeks, setting higher swing lows (so far) while most averages have set lower lows. We are monitoring $TAN for a potential breakout entry to add to our existing long position.
United States Oil Fund ($USO) broke out from a five-week consolidation last week, but failed to close above the highs of the range on the weekly chart (but not by much). A false breakout is fairly common with bullish chart patterns and we usually like to see a stock or ETF recover from a false breakout within a few sessions. This means that $USO should probably hold support at the rising 20-day EMA and close back above $38.60 by the end of the coming week. A move above last Friday’s high (+ 5 cents) is a low risk point for subscribers who are not already in.
After breaking down below an important swing low two weeks ago, iShares Dow Jones US Real Estate ($IYR) is setting up for a major trend reversal as long as the price action fails to probe above the highs of June (just below $70). $IYR should have a hard enough time getting back above $66, due to resistance from a declining 10-week MA.
Our existing position in First Trust ISE Revere Natural Gas ($FCG) continues to trade in a tight range on the weekly chart, holding above support of the 10-week moving average. The weekly chart really shows how the price action has tightened up since mid-July. From March to June, the average 6-week price swing from high to low was around 14%, but over the past 6-weeks the high to low of the range is slightly less than 5%, so the action has tightened up considerably. Whenever the price action coils up up near the highs of the range (within a long consolidation) it is usually a bullish sign, indicating that a potential breakout is near.
Yesterday, that patience paid off because $USO (crude oil ETF) convincingly broke out above key resistance of an 8-week base of consolidation. Not surprisingly, yesterday’s heavy selling in the market caused several of our individual stock positions to hit their stops. However, after yesterday’s 2.4% gain, our current position in $USO is now showing an unrealized share price gain of nearly 8% since our buy entry. Also, the position in our leveraged Silver ETF ($AGQ) is now up approximately 10% since our August 21 buy entry.
Due to yesterday’s stalling action in the averages, we have tightened up the stops in a few ETF positions. We are sticking with a loose stop in $TAN, as wee are only holding a 25% position and would like to see how the price action holds up at the 50-day MA over the next few weeks.
One week ago, we pointed out the bullish trend reversal pattern of iShares Silver Trust ($SLV) and said we were stalking the ETF for potential buy entry. Specifically, we said, “$SLV has convincingly broken out above resistance of a downtrend line (dotted black line) that had been in place throughout all of 2013. That breakout above the downtrend line also coincided with a sharp move back above its 10-week moving average (roughly equivalent to the 50-day moving average on the daily chart). Furthermore, last week’s rally in $SLV was confirmed by a sharp increase in volume. This, of course, indicates institutional money flow into the ETF.”
The iShares U.S. Real Estate ETF ($IYR) looks to be in trouble after an ugly breakdown below the 200-day MA (same as 40-week MA) in August. The weekly chart is pretty ugly, as the mutli-year uptrend appears to be reversing to downside.