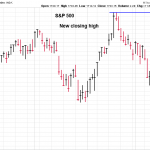
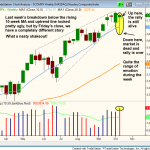
After a 33% rally from its last base breakout at $15, Global X Social Media Index ETF ($SOCL), is now in base mode the past few weeks. The first pullback to the rising 10-week MA after a strong breakout is usually an area that is supported by institutions, and we clearly see that last week, as $SOCL dipped below the 10-week MA but closed back above it by the end of the week. The base looks like it needs a few more weeks of consolidation, which should hold above $19, minus a few shakeouts. We will continue to monitor the action for a low risk entry point off the 10-week MA.

Continue Reading...

Turnover was lighter once again, so technically the S&P 500 or NASDAQ has yet to produce an accumulation day. However, we noticed plenty of bullish reversal candles on the weekly charts of leading stocks and major averages. The weekly chart of the NASDAQ Composite below shows the bullish reversal action after an undercut of the uptrend line and 10-week MA. Thursday’s gap up was very strong, and probably left a ton of traders in the dust after getting stopped out earlier in the week.

Continue Reading...

The monthly chart of iShares Dow Jones US Telecom ($IYZ) below shows a recent breakout above a significant resistance level at $26 earlier this year. Since then, the price action has chopped around in a tight range above the prior highs of the last base. A breakout above the recent range could spark a rally to or near the pior highs of 2007, around the $32-33 area.

Continue Reading...

A while back, we discussed a potential breakout in the Claymore/AlphaShares China Small Cap ETF ($HAO), as it bounced higher from a double bottom pattern with a slight undercut of the prior low on the weekly chart below. On Friday, $HAO cleared the highs of a three-week range on better than average volume, signaling the uptrend may be ready to resume after a nine month long consolidation.

Continue Reading...