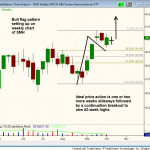
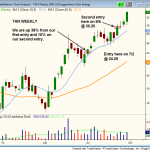
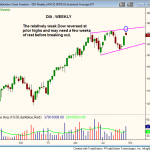
After a strong surge off the August lows, Merrill Lynch Semiconductors HOLDRS ($SMH) is in pullback mode the past two weeks. If the price action continues to consolidate above the 38% Fibo level connecting the last swing high and low on the weekly chart below, then we could see a bull flag type pattern develop. With bull flags, we love to see symmetry. If the pole section of the flag takes 5 weeks to form, then the flag portion should take no more than 3 to 5 weeks (maybe even 6) before breaking out. One or two more weeks sideways would be ideal in $SMH, followed by a breakout to new highs on the year.

Continue Reading...

We have one new official buy setup on today’s watchlist in the iShares MSCI Japan Index ($EWJ). After several months of basing action, $EWJ is poised to breakout, with the price action tightening up a bit over the past two weeks above the 50-day MA. Currently, $EWJ is in pullback mode, trading just above the rising 20-day EMA. Note that the 20-day EMA has crossed above the 50-day MA, and has turned up for a few weeks now.

Continue Reading...

Due to concerns over a potential government shutdown, stocks opened significantly lower across the board. However, the selling was limited to the open in the NASDAQ and Russell 2000, as both averages powered higher the rest of the day before selling off into the close and finishing with minor losses. At one point during the afternoon, both the Russell and NASDAQ managed to turn green, which was impressive considering the weak open.

Continue Reading...

We are canceling the $XLK trade from Friday in favor of a bullish setup in the First Trust Financials AlphaDEX Fund ($FXO). $FXO has recently pulled back to the rising 50-day MA after stalling at the prior high. The 20-day EMA has just crossed above the 50-day MA, which is a positive sign, signaling that the current consolidation may be close to breaking out. This isn’t a guarantee, but the moving averages point to a positive shift in momentum over the past few weeks. The 200-day MA remains in a clear uptrend. We look for $FXO to chop around for a few more days or weeks above the 50-day MA, minus a few shakeout bars. As long as the price action holds above the 50-day MA, then it should eventually break the downtrend line and a move to new highs.

Continue Reading...

We return to the chart of iShares MSCI Japan ($EWJ) tonight, because we are placing $EWJ on our watchlist as an official buy setup (trade details can be found above). After breaking the downtrend line of the consolidation, the price action is now sitting on top of all the major averages, just below resistance of the July mid-point at $12.20. The moving averages are finally in order, with the 20-day EMA (in beige) now trending higher for the past few weeks and above the 50-day MA (blue). The 50-day MA is also sloping slightly higher, and the 200-day MA (orange) remains in a clear uptrend.

Continue Reading...

Stocks closed in mixed territory, with modest gains and losses. Once again, it was the NASDAQ Composite and small cap Russell 2000 showing relative strength by holding above yesterday’s low and the 10-day MA. Although the S&P 500 undercut the prior day’s low and the 10-day MA, the price action is much more bullish than the Dow Jones, which closed near the 50-day MA. Volume did pick up on the NYSE, but its tough to label the S&P 500 a clear cut distribution day with only a -0.26% loss.

Continue Reading...

The relative strength on the weekly charts of $IWM and the NASDAQ Composite is easy to see, with a clear sequence of higher highs and higher lows in place since April. While the $DIA must overcome prior highs to breakout, there isn’t much in the way of resistance for $IWM, other than the top trendline, which is about 3% to 4% away. The NASDAQ chart is pretty much the same, but may need to rest after touching the top trendline last week. However, any pullback should be short-lived, as there isn’t much in the way of resistance until 4,000.

Continue Reading...