Current long positions in ETFs $USO and $TAN rallied at least 2.5% higher on increased volume. $IEO and $FCG also added to recent breakout gains. Last night’s breakout buy setup in $XBI triggered, and we are now long. We look for the price action to follow through to the upside with a close above $131 within the next few days. iShares Silver ETF ($SLV) printed a bullish reversal candle on heavy volume after undercutting the 50-day moving average on the open.

Continue Reading...

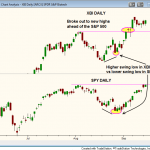
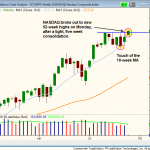
The Fed will release its decision on rates tomorrow afternoon (2:15), so we can expect some afternoon volatility. Over the years, we have noticed that many traders will not take a position in a stock ahead of the Fed or even move to a 100% cash position before the report. The way we deal with the Fed is the way we deal with all news, we simplify everything down to price and volume action. Our goal is to concentrate on the price and volume action of each stock, as that will tell us when to buy, sell, or hold. It’s not the news that matters to us, so much as how our stocks/ETFs respond to the news. SPDR S&P Biotech ($XBI) has broken out to new highs for the year well ahead of the S&P 500, which is detailed on the chart.

Continue Reading...

Relative strength is an important tool we use every day in scanning for stocks and ETFs. Pattern relative strength, where we compare significant swings highs and lows in a stock or ETF against a broad market index like the S&P 500 is an easy way of identifying what is and isn’t strong. A good example of this is the recent price action in the iShares U.S. Home Construction ETF ($ITB), which just broke above the downtrend line on the weekly chart.

Continue Reading...

After an ugly selloff from last December to late June, Market Vectors Egypt ETF ($EGPT) reversed off the lows on big volume and rallied 20% higher before stalling out around $47. After a near two month consolidation that held above the rising 10-week MA, $EGPT broke above the highs of the range this week on a pick up in volume. The price action also cleared the 40-week MA (in orange) on the weekly chart.

Continue Reading...

After an ugly nine month long selloff in Market Vectors Gold Miners ($GDX), there is a potential reversal of trend in place with a higher low and higher high printing in July and August, along with an inverted head and shoulders pattern that formed from 5/17 to 8/9. The pattern did have nice symmetry, with six candles separating the left and right shoulders from the center or head.

Continue Reading...

With the NASDAQ moving to new highs, the weekly bull flag pattern that we mentioned last week is moving out right on schedule. If the breakout leads to a measured move, then the NASDAQ could potentially rally another 12% on the next leg up to 4,000. At the very least, the NASDAQ should be able to cover 62% of the last move up, which puts it around 3,800.

Continue Reading...

With the market yet to produce a buy signal, those who lack conviction on the long side may find it difficult to hold on to a long position when there is a short-term shakeout in the market. This is why it is always important to plan the trade and trade the plan. Most of us are guilty of an impulse trade every once in a while, but for short to intermediate-term swing traders, this should not become a habit. Getting in and out of positions quickly, based on short-term intraday moves, is a pretty good sign of over trading. When this happens it is best to take a short break from trading to clear the mind.

Continue Reading...