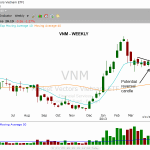
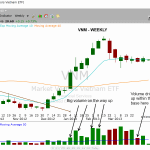
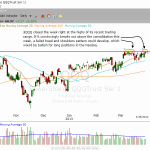
Earlier in the week we posted a chart of Market Vectors Vietnam ETF ($VNM), looking for a breakout above a tight-ranged consolidation after forming a higher low on the daily chart. $VNM broke support at 20.13 a few days ago, so we removed the setup from our watchlist. $VNM returns to the watchlist today as a buy setup if the price action can return back above the 20-day EMA and our original entry point.

Continue Reading...

The trade setup to buy iShares Singapore Index ($EWS) did not yet trigger, but remains on our watchlist going into today. In addition, note we have listed a NEW setup to potentially buy Semiconductor HOLDR ($SMH) on a pullback to the area of its 50-day moving average. Note this is a BUY LIMIT order, which means we will only buy if the ETF retraces down to that price level. We have a few new stock setups on today’s watchlist. Because we plan out our trading day in advance, sometimes we have to list several setups becuase we never know exactly which ones will trigger.

Continue Reading...

Shares MSCI Singapore Index Fund ($EWS) is back on our watchlist after a failed breakout attempt last February. Since then, the price action has undercut the 50-day MA and popped back above. After another false breakout attempt on April 3, $EWS found support from the rising 50-day MA and prior swing high (dotted black line) around 13.75. We could potentially see a breakout above the 4/3 high take place in $EWS within the next few days, which would be our buy point.

Continue Reading...

One of the best looking country ETF charts we found was the Market Vectors Vietnam ETF ($VNM). The weekly chart is quite powerful, as it shows the huge pick up in volume during the rally as the price action cleared the 40-week MA (in orange). The price action is now consolidating in a tight range around 10-week MA (teal line). Note the dry up in volume two weeks ago, which indicates that investors have lost interest in trading $VNM as it continues to base out.

Continue Reading...

In our initial analysis, we said of the “handle” portion of the chart, “While forming, price action will typically slope lower. In the case of $UNG, even an ‘undercut’ of the March 25 low and 20-day exponential moving average would be acceptable.” Last Thursday, an “undercut” of the March 25 low and 20-day EMA is exactly what happened. The following day, $UNG jumped 4.5% and broke out above the high of its 3-week range. This is shown on the daily chart.

Continue Reading...

When our timing model shifts to sell mode we are basically saying that the market is vulnerable to a sharp selloff. At this point, one should consider taking profits on extended positions (that show signs of weakness) or trail tight stops to protect gains. If your stock or ETF does not budge while the market is under distribution, then by all means do not sell, as you may be holding on to a position that is a true market leader. We scanned a list of country ETFs to locate strong patterns forming near 52-week highs. Here are a few names off that list:

Continue Reading...

Last night, we (Deron and Rick) spent several hours manually scanning the chart patterns of more than 900 stocks and ETFs. While the MTG Stock Screener is a fantastic time saver in steadily trending markets, markets in transition require the added interaction of human discretion, which is one of the key reasons traders subscribe to The Wagner Daily newsletter. Just because our market timing model is now on a new “sell” signal, does NOT mean we should immediately start selling short stocks and ETFs with reckless abandon. Why? Because one of the main rules of our trading strategy is that we always trade in the dominant direction of the broad market trend.

Continue Reading...

To accommodate both stocks and ETFs, the new cash account value of the single model portfolio is $100,000. The account will remain marginable, with total maximum buying power at $200,000. The new portfolio sizing also makes account sizing much easier than before, as a 10% position is now simply $10,000, while a 15% position is $15,000. The goal of the model portfolio remains the same as before, but now with just one easy to follow account. We will still trade whatever the market is offering at any given time, and the quantity of stock and ETF trades will remain exactly the same as before.

Continue Reading...

In the March 25 issue of The Wagner Daily, we illustrated how PowerShares QQQ Trust ($QQQ) was forming the right shoulder of a bearish head and shoulders formation on its weekly chart. Although that head and shoulders pattern is technically still intact, $QQQ is now trading at the highs of its recent trading range. If $QQQ moves any higher in the coming days, it will break out above the highs of its recent range. If that happens, the right shoulder will become higher than the left shoulder, and there will be increased odds of the head and shoulders pattern transforming into a failed head and shoulders. Below is an updated daily chart of $QQQ:

Continue Reading...