Most leading ETFs or stocks are in need of a few weeks of rest after a decent advance and recent increase in volatility: iShares Dow Jones Transportation ETF ($IYT) broke out from a 10-month long base and rallied about 15% before stalling out. Note the pick up in volatility the past two weeks. This is a sign that the price action may need a few weeks of base building. A 4-5 week base above the 50-day MA would be ideal.

Continue Reading...

$QQQ could push higher over the next few days, but there is plenty of overhead resistance around 67.00. There is resistance from the 50% to 61.8% Fibo retracement levels around 67.00 (measured from recent swing high to Tuesday’s low), as well as the declining 20-day EMA. The close and low of first ugly reversal candle on 2/20 is at 67.00. Also, all through January, $QQQ struggled to clear 67.00

Continue Reading...

The Nasdaq 100 tracking ETF $QQQ closed back below the 50-day MA yesterday, with an ugly, wide ranged reversal candle. Although the 200-day MA support level is just below, when the market is in distribution mode the price action can slice through important moving averages like a hot knife through butter. Moving averages work really well in a bull market, but not so much when conditions turn sour.

Continue Reading...

How will the market act this week? Will the S&P 500 and Nasdaq recover and clear prior swing highs on heavy volume, or stall out after a light volume bounce and roll over? We do not know. As always, we operate with no crystal ball and prefer to react to price and volume action rather than attempt to predict. After leading the market higher in 2011 and much of 2012, iShares NASDAQ Biotechnology Index ($IBB) has spent the past few months digesting gains and building a new base off the 200-day MA. The past few weeks have been very quiet, with the price action forming a tight range near the highs of the base.

Continue Reading...

As far as the charts of the major averages go, the S&P 500, Russell 2k, and S&P 400 appear to be in decent shape. The same can not be said of the Nasdaq, which has taken a beating the past two sessions, and is closing in on the 50-day MA. The Nasdaq 100, which basically did not budge the entire rally is already below the 50-day MA. Looking at the daily chart of the S&P 500 below, the price action may be headed for an undercut of the prior swing low around 1,494.

Continue Reading...

Energy, financial, and construction stocks fueled the rally in the S&P 500 the past two months. ETFs from these groups put in ugly reversal bars on Wednesday. $KBE and $XES printed bearish reversal candles, while $ITB broke down on higher volume. The price action in these ETFs indicate that the S&P 500 may soon need a few weeks of rest. As mentioned above, SPDR KBW Bank ($KBE) closed with a bearish engulfing pattern on Wednesday. The candle was pretty wide, covering about six sessions worth of price action.

Continue Reading...

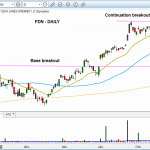
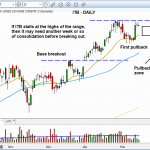
Many traders get caught up in making all or nothing decisions in their trading. For example, there were probably many traders who could not pull the trigger on the buy side after the big market gap up in early January. Many may have simply said “Man, this is too high, I’ll just wait for a pullback”. They could not pull the trigger out of fear of losing money. When we are in a similar situation, we take pressure off by acknowledging that in order to make money we have to take on risk (this is what we do). Then, rather than buying a full position, we buy a half position, a third, or even a quarter and try to add on success. This small position give us some confidence if it works, and we can build on that confidence with follow up buys. If the buy does not work, so what, we lost a little bit of money.The First Trust Dow Jones Internet Index ($FDN) broke out from a short-term consolidation yesterday.

Continue Reading...

During any strong advance, there will always be a few shakeouts along the way. We know from experience that it is never easy to stay long when the market is extended. This is why we focus on individual setups and the distribution count (of major averages) to gauge the health of the rally. Trade what you see, not what you think! The Claymore/MAC Global Solar Index ($TAN) broke out from a tight, month long base last week.

Continue Reading...

After gapping slightly lower on yesterday’s open, stocks quickly reversed their initial weakness. By midday, all the main stock market indexes had recovered back to the flat line. Thereafter, the broad market traded mostly sideways into the close. The S&P 500, Nasdaq Composite, and Dow Jones Industrial Average all finished within 0.1% of unchanged levels. However, the small-cap Russell 2000 and S&P Midcap 400 indices continued to show relative strength and closed in positive territory. Total volume in both the NYSE and NASDAQ was 6% higher than the previous day’s levels.The iShares Dow Jones US Home Construction ($ITB) broke out from a bullish base on January 2, and rallied about 10% higher before stalling out just below 24.00. After a two-week pullback off the highs, $ITB rallied sharply off support of the 20-day EMA but stalled once again just below 24.00.

Continue Reading...

Solar stocks have made a comeback the past few months, with $FSLR leading the way and $SCTY, $WFR, and $JKS exploding higher as well. The Guggenheim Solar ETF ($TAN) is heavily weighted in leading solar stocks from the United States and China. Recently, $TAN has reversed a long-term downtrend and is beginning to show classic signs of a bullish trend reversal. On the weekly chart below, the 10-week MA has crossed above the 40-week MA, which is a bullish moving average crossover signal.

Continue Reading...