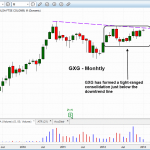
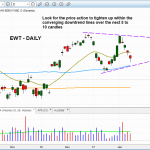
We have two new buy setups on the watchlist for Monday. We are looking to add to an existing position in $EWT on a range breakout. The second setup is in $GXG:For the past few weeks, we have been monitoring the action in the Global X InterBolsa FTSE Colombia20 ($GXG) for a decent buy entry. Before we dive into the daily chart and our buy setup, let’s revisit the monthly chart which we posted a few weeks ago:

Continue Reading...

We added one new position to the ETF portfolio yesterday in $RWO. As mentioned in Wednesday’s report, $EPI triggered a buy entry over the two-day high for those who missed our initial entry point.The iShares MSCI Taiwan Index ($EWT) triggered a buy entry in the ETF portfolio on Jan. 9, over the high of Jan. 8. It looks as though $EWT is forming a pennant, setting a series of lower highs and higher lows within a tight range.

Continue Reading...

Market Vectors-Coal ($KOL) continues to chop around after clearing the 200-day MA on Jan. 2. It has been trading below the 26.25 – 23.35 breakout pivot on light volume the past two days. Ideally, we would like to see the price action pullback to the 200-day MA and form some sort of bullish reversal candle. The area we are looking at is somewhere between the 20-day EMA and 200-day SMA.

Continue Reading...

The WisdomTree India Earnings Fund ($EPI) buy setup triggered and we are now long. Although the price action failed to follow through on the open, the push off the lows in the afternoon allowed $EPI to close well off the lows of the day. A move above Tuesday’s high on Wednesday would be ideal. We canceled the $EWS buy setup but we will continue to monitor the action for a low risk entry.In yesterday’s commentary we mentioned the iShares MSCI Taiwan Index ($EWT) as a potential pullback setup within the next few days. Yesterday’s action in $EWT provides us with a low risk entry point for partial size. We will look to add to the position if the price action moves in our direction. We look for the price action to tighten up over the next few weeks in between the converging downtrend lines while holding above the 50-day MA. Bullish basing patterns should tighten up before they breakout.

Continue Reading...

On the hourly (60-minute) chart interval, $EPI has just retraced to “undercut” its 20-period exponential moving average (20-EMA), which usually provides near-term support in strong breakouts. The ideal Pullback Buy Setup is at least 3 to 7 days in length (retracement from the high), with volume declining on the pullback, and orderly price action along the way. So far, this setup meets our criteria for pullback entry. Although we’d love to see $EPI pull back closer to the prior breakout level at $19.40 in order to establish an even lower risk position, we do not want to miss the next potential move higher when the bullish momentum of the recent breakout resumes. As such, we have placed $EPI on our official ETF Trading watchlist as a possible buy entry today.

Continue Reading...

We established one new long position in the SPDR S&P Homebuilders ETF ($XHB) on Friday. Our breakout buy setup in the iShares MSCI Singapore Index ($EWS) did not trigger, but we’ll continue to monitor the action for a potential pullback entry off support of the 20-day EMA (if it gets there). Another potential pullback entry we are monitoring is in the WisdomTree India Earnings Fund ($EPI). $EPI broke out from a tight four week consolidation (or handle) on a nice pick up in volume, which is a bullish sign. The tight consolidation held above the 20-day EMA before breaking out on January 2. We are looking for a three to five candle pullback that finds support somewhere in the 19.50 area. $EPI does not have to pull back at all and could simply just go sideways for a day or two before resuming its uptrend.

Continue Reading...

iShares MSCI Singapore Index ($EWS) has been in consolidation mode since mid-September. After finding support at the 200-day MA and rallying to but stalling at the prior high, the price action has pulled back to the rising 20-day EMA. We look always look for price action to tighten up within the base (this a bullish sign) and $EWS has done that over the past few weeks. $EWS may need another week or two of sideways action before it is ready to breakout, but if broad market conditions continue to improve this setup may be ready to trigger within the next few days. Please see the watchlist section above for trade details.

Continue Reading...

We removed $INP from the watchlist due to the big gap up. Please note the changes made to $XHB. We raised our entry price in hopes of catching a slight pull back in price and also reduced our share size to keep trade risk the same. If $XHB touches the trigger price and your order is not filled, please enter the trade immediately at the market. Our scans did not turn up many actionable setups and that is to be expected after such a big gap up. We were able to find one ETF that has been consolidating in a tight range the past few months after breaking a weekly downtrend line. Market Vectors-Coal ($KOL) is currently forming a “base at the lows” after a significant decline from the highs of 2011. These lower level bases can be tricky to enter, as we usually see one or more false breakouts along the way before the real breakout occurs.

Continue Reading...

With the timing model back on a buy signal, we want to continue to build up our long exposure as setups develop. $EPU triggered a buy entry in the ETF portfolio on Monday and we have two new buy setups on today’s watchlist. Both setups are buy limit orders to protect the trades against a potential gap up. If these setups hit the trigger price and your order is not filled, please enter the trade immediately at the market. The weekly chart of the SPDR S&P Homebuilders ($XHB) shows three months of tight basing action at the highs with a false breakout in early November that led to another nine weeks of consolidation.

Continue Reading...

With the market in short-term oversold territory, the reward to risk ratios do not favor establishing new short positions at current levels. However, our long watchlist did produce a few potential buy candidates and one new watchlist setup in the iShares MSCI All Peru Capped Index Fund ($EPU). The weekly chart below is showing a potential long-term downtrend line breakout after a tight ranged, multi-month consolidation.

Continue Reading...