In the September 14 issue of The Wagner Daily, we said, “The market rally continues to pick up steam with more groups participating in the advance. The financial sector has picked up some momentum the past few weeks, with the S&P Select Financial SPDR ETF ($XLF) breaking out from a six-month base on Thursday (September 13).” Today, we will follow-up that analysis by examining in more detail the increasing bullish momentum in the financial sector.

Continue Reading...

Thursday’s move was confirmed by heavy volume and solid internals. NYSE volume came in well above its 50-day average and 30% above the prior day’s level. NYSE advancing volume out paced declining volume by a healthy 9 to 1 margin. Nasdaq volume also finished above the 50-day average and 11% above Wednesday. Nasdaq advancing volume beat declining volume by a respectable 3 to 1 margin. The market volume pattern remains bullish, as institutions were actively buying on Thursday.

Continue Reading...

With an announcement on economic policy to be presented by the Federal Reserve Board today (Thursday afternoon), most big market players were probably on the sidelines today. Likewise, we generally are not thrilled to jump into new positions ahead of a Fed day, unless the overall environment happens to be extremely bullish. As such, we will keep today’s ETF analysis and broad market commentary short.

Continue Reading...

Yesterday, our position in iPath DJ Grains ($JJG) hit its protective stop, just below the August 28 “swing low,” knocking us out of the trade with a small loss. We initially entered the trade because we liked the bullish “pennant” formation that was forming at multi-year highs. Despite getting stopped out of the trade yesterday, the technical trade setup still looks pretty good, and there are still favorable odds that the continuation chart pattern will follow through with a breakout to new highs. However, it now appears as though JJG will first “undercut” support of its 50-day moving average before breaking out. A quick probe below the 50-day moving average, combined with the formation of a bullish reversal candlestick, would present us with an even lower risk re-entry point than our initial entry price. If that scenario happens, we plan on re-entering the trade above the high of the reversal bar.

Continue Reading...

We did a lot of scanning for new, low-risk ETF swing trade setups after the close, and frankly there was not much to be found. Most of the strongest ETFs, such as iShares Nasdaq Biotechnology Index ($IBB), which we just sold for a nice gain last week, have begun to pull back from their highs, but not yet by enough of a margin to consider trade re-entry. If we see a few more days of sideways to declining price action in the broad market, it may create select buying opportunities, and we will be sure to alert you of such.

Continue Reading...

On Thursday, September 6, we reported that we sold iShares Nasdaq Biotechnology Index ($IBB) for a 5% price gain when it hit its price target on Wednesday. Last Friday, one day later, DB Gold Double Long ($DGP) hit its target as well, causing us to sell it for a gain of 8.5% with a holding period of less than a week. Our entry and exit prices in DGP are shown on the daily chart below.

Continue Reading...

Per the intraday confirmation alert, we closed out our long position in the Ishares Nasdaq Biotech ETF (IBB) when it hit the official target price of 140.80. We locked in an $1,100 gain (2% in the portfolio) on a 5% move from our entry point. Although IBB can easily move higher from here we do not mind selling in to strength and moving on to the next trade. The chart below details the entries and exit. Although our first entry on 8/14 was on reduced share size, the tight price action over the next seven bars allowed us to increase our exposure with a low risk entry point on 8/24.

Continue Reading...

When gold ETFs broke out on August 31, we bought DB Gold Double Long ($DGP), a leveraged version of the popular SPDR Gold Trust ($GLD). In the following day’s commentary, we briefly pointed out that silver ETFs (such as $SLV) had broken out as well. In fact, the spot silver commodity has actually been outperforming spot gold (and the corresponding precious metals ETFs) in recent weeks. So, if silver ETFs have been showing more near-term strength than gold ETFs, why did we buy a gold ETF instead? Read on to see…

Continue Reading...

Although the closing prices of the main stock market indexes were rather mixed yesterday, make no mistake that it was indeed an overall bullish trading day. For starters, stocks managed to shake off significant morning selling and subsequently recover all the way back to test their intraday highs. Afternoon strength and resilience is a common trait of healthy markets. But even more important was the clear relative strength of small-cap stocks.

Continue Reading...

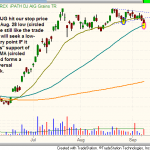
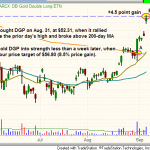
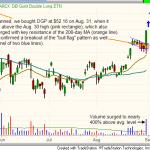
Throughout the latter half of last week, we were stalking DB Gold Double Long ($DGP), a gold ETF that is a leveraged version of the popular SPDR Gold Trust ($GLD), for potential buy entry (subscribers may want to log in to the Members Area and review our August 27 newsletter for our initial trade analysis, as well as the August 29 issue for follow-up analysis). Going into last Friday’s session, DGP was listed on our ETF watchlist as a potential swing trade buy entry, just above the high of the previous day (August 30), which also converged with the 200-day moving average. Gapping higher on the open, DGP quickly triggered our buy entry, violently reversed all the way back down to just below the previous day’s low, then headed back up again. Ultimately, this wild intraday price action was a “shakeout” that absorbed overhead supply (resistance), and enabled DGP to more easily move higher in the afternoon.

Continue Reading...