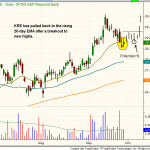
As we enter the last quarter of 2012, let’s take an updated look at the technical daily chart pattern of the S&P 500 SPDR ($SPY), a popular ETF proxy for the benchmark S&P 500 Index. As annotated on the daily chart above, notice that $SPY is presently trying to cling to near-term support of its 20-day exponential moving average (the beige line). In a strong uptrend, this moving average often acts perfectly as support for enabling an index, ETF, or stock to resume its uptrend (assuming a firm uptrend is already in place). As an example of this, notice how the 20-day exponential moving average perfectly acted as support in late August (point “A”). As such, we will be looking for signs of whether or not SPY holds near its current price and starts to head back up in the coming days.

Continue Reading...

In last week’s commentary we provided a chart of the SPDR KBW Regional Banking ETF ($KRE), which was in pullback mode after breaking out to new 52-week highs in mid-September. Although the price action has retreated back to the rising 20-day EMA, the action as it touched the moving average (on 9/25) was ugly, as it basically closed at the lows of the day on a wide ranged bar. We continue to wait for a bullish reversal candle to signal a low-risk buy entry, but a move above the two day high is a potential entry point to begin building a position. One could wait for the price action to push higher and form a higher low (HL) at or around the 20-day EMA (within the next two weeks) before adding to the position on a potential second move out. The chart below details the ideal price action to establish a higher low.

Continue Reading...

Presently, we are already holding a well-performing position in the US Natural Gas Fund ($UNG), which is a commodity ETF tied to the price of natural gas futures contracts. Now, we have also spotted a similar, but different, swing trade setup that we like as well. The new potential trade entry is First Trust Natural Gas ($FCG), a related ETF whose portfolio is comprised of a basket of individual natural gas stocks, rather than the actual commodity.

Continue Reading...

Not surprisingly, most of our open ETF positions registered losses yesterday. However, one exception was US Natural Gas Fund ($UNG), which bucked the trend by zooming 2.2% higher amidst the broad market losses. Two days ago, in the September 24 issue of The Wagner Daily, we pointed out the potential bullish trend reversal that was setting up in UNG. Yesterday, our analysis follow-through as anticipated, as UNG convincingly broke out above long-term resistance of its 200-day moving average. In the process, it triggered our buy entry in the model ETF trading portfolio, and the trade is now showing a small unrealized gain.

Continue Reading...

One not so obvious situation we observed in yesterday session was the relative strength in international ETFs. In the September 21 issue of The Wagner Daily, we discussed that international ETFs, particularly those of emerging markets, were starting to show signs of bullish price momentum. That initial observation is now being manifested by the fact that all the ETFs we discussed that day managed to close slightly higher in yesterday’s session, despite the losses in the S&P 500 and Nasdaq. The iShares Philippines Index ($EPHE), which we bought in our model ETF portfolio on September 21, gained 0.8% yesterday. The other international ETF we bought the same day, iShares Emerging Markets ($EEM), managed to eke out a gain of 0.1%. The iShares Hong Kong Index ($EWH) and iShares Mexico Index ($EWW), both of which have also been on our radar screen over the past several days, rose 0.3% and 0.2% respectively.

Continue Reading...

Unlike our stock trading strategy, which focuses primarily on Breakouts and Pullbacks in uptrending markets, we afford ourselves a bit more diversity with our ETF trading strategy because we also seek to take advantage of ETFs reversing from downtrends. This is particularly true with ETFs that have a low correlation to the direction of the broad market, such as currency, commodity, fixed income, and international ETFs. One ETF we are stalking for potential short-term buy entry now is U.S. Natural Gas Fund ($UNG).

Continue Reading...

In yesterday’s newsletter, we pointed out the potential trade setup in iShares Emerging Markets Index ($EEM). Although listed on our watchlist, the trade did not hit our trigger price for buy entry. However, yesterday’s price action in EEM now makes our reward to risk ratio even more favorable for buy entry because the ETF gapped lower on the open, then reversed to close at its intraday high.

Continue Reading...

Going into today’s session, we have added Alerion MLP ETF ($AMLP) to our official watchlist for potential trade entry. On the chart above, notice the clearly defined price resistance at the $16.60 level. A rally above the tight consolidation of the past several days would correspond to a breakout above this level, which would trigger our buy entry (see trade details in the ETF Watchlist section above). Our initial stop is just below the low of the breakout day from September 14, but we plan to raise the stop, at least on partial share size, as soon as this trade triggers for buy entry and starts moving higher.

Continue Reading...

In yesterday’s commentary, we said there is currently a lack of new ETF trade setups with low-risk entry points at current levels, but that we were continuing to build an increasing list of ETFs with relative strength to be considered for potential swing trade entry when the stock market pulls back or enters into a new base of consolidation. The moderate decline in yesterday’s session was a good start that caused most ETFs to retrace from their recent highs, but the pullback was not yet substantial enough to cause any individual ETFs on our radar screen to form low-risk entry points for swing trading. However, we continue building to that list with new potential trade setups. Today, we look at the buy setup in Rogers International Commodity Index ETF ($RJA).

Continue Reading...